Measuring success in the restaurant business goes beyond just having full tables and a bustling kitchen.
It's essential to dive into the nitty-gritty details and understand the metrics that truly determine your performance.
This article will shed light on the five crucial restaurant sales metrics that every restaurateur needs to track for a thriving business.
We'll decode these data-driven measures, helping you gauge the effectiveness of your strategies, identify potential problem areas, and, importantly, steer your restaurant toward higher profits.
Let’s get started with an essential metric you are most likely already familiar with.
Total Sales
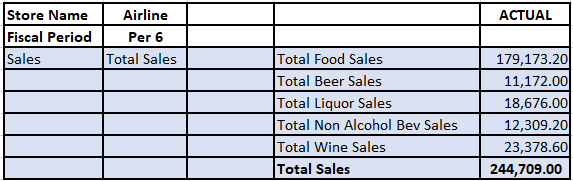
Your restaurant’s total sales metric is a quick and effective way to see how your business is performing.
Despite being one of the most critical metrics to monitor, total sales is also one of the simplest to track.
In fact, this information is typically at your fingertips in your POS (Point of Sale) system, much like what you see in the image below.
Source: Mirus
Your POS system will likely provide more detailed insight into various components of your overall sales.
For example, food sales, beverage sales, and other products you might sell at your establishment.
Why is this data essential? For one, it gives you the power to benchmark your performance against the broader restaurant industry.
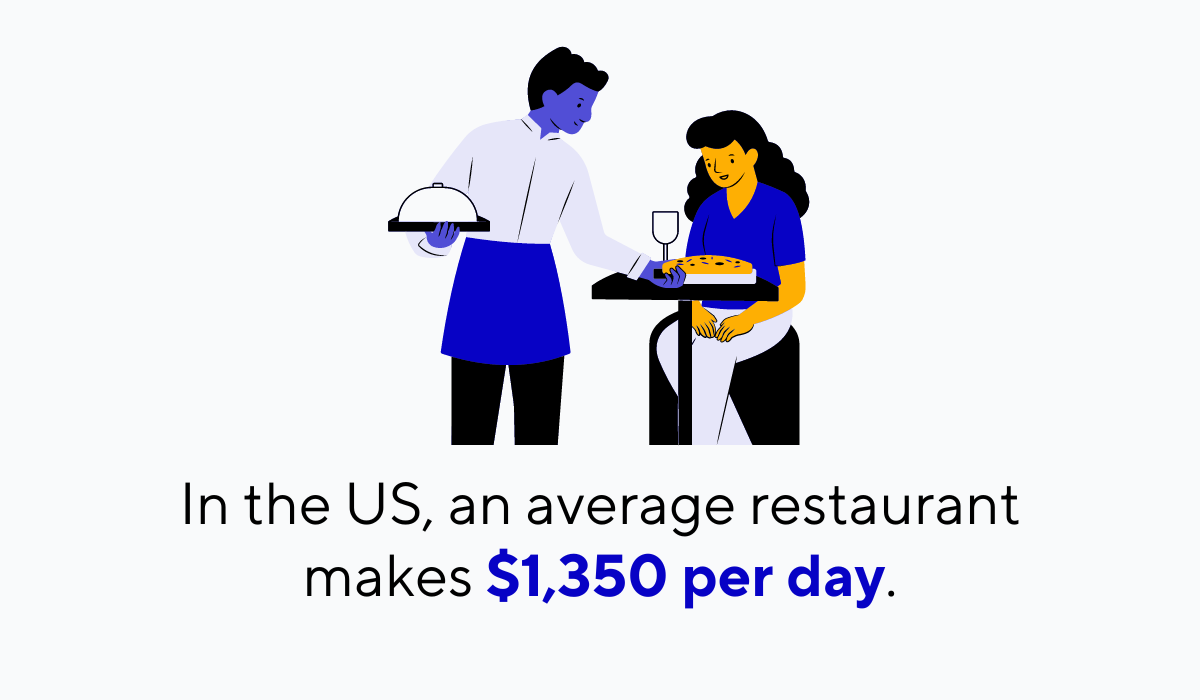
Illustration: Tablein / Data: EatPallet
The image above illustrates data from EatPallet, stating what the average US restaurant earns daily, amounting to about $40,500 per month.
Compare your sales to these figures. If your numbers align with or surpass the average, that's fantastic.
However, if they don't, it might be time to reassess some elements of your restaurant operations and find ways to increase your sales.
However, low total sales don't necessarily need to sound an alarm.
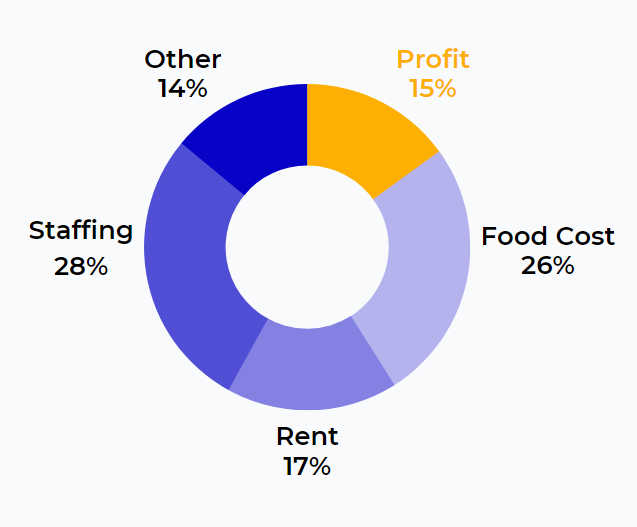
Source: Tablein
It's essential to view these figures through the lens of your restaurant’s operational costs, including rent, staffing, food, and others.
It's a balancing act, aligning sales and expenditures for optimum performance.
Remember that total sales data is the foundation for the upcoming metrics we'll explore. So, buckle up as we dive deeper!
Average Check per Guest
One such metric that you should definitely track is called the average check per guest.
This metric is exactly what it sounds like—it's the average amount each customer spends at your restaurant.
This figure is influential because it gives you insight into your customers' spending habits and preferences.
So how do you calculate this metric? As you can see in the following image, the process is straightforward.
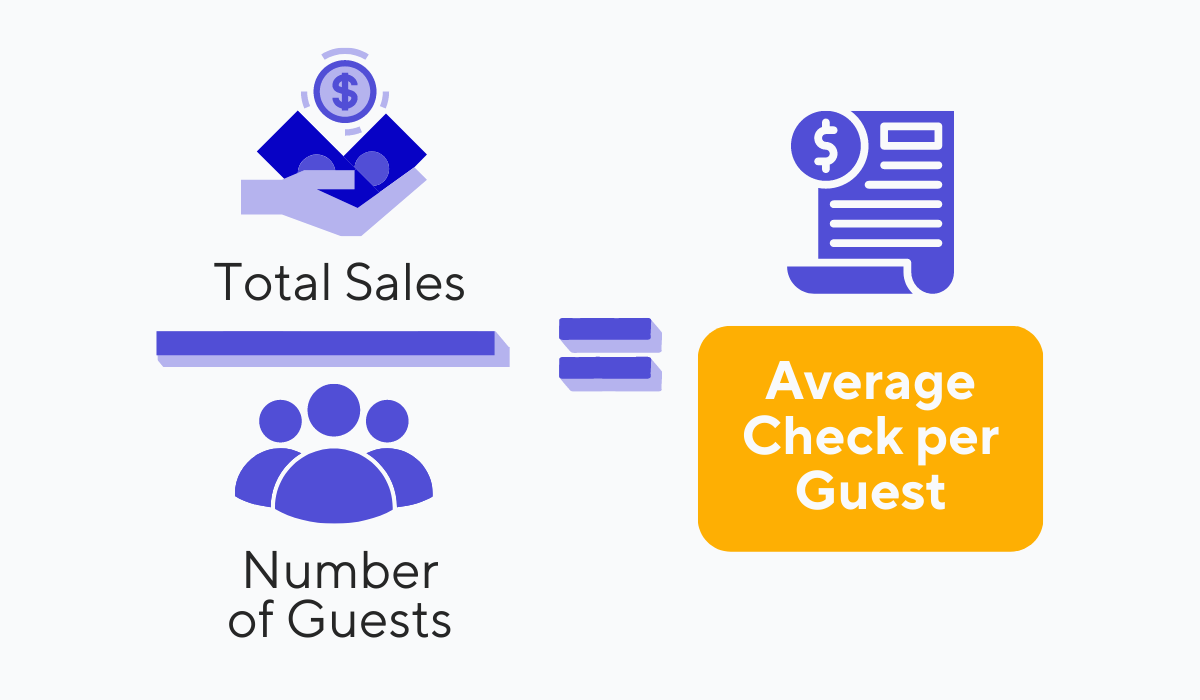
Source: Tablein
Take your total sales for a specific time period, then divide that by the number of guests you served in that same period.
You can calculate it daily, weekly, or monthly, or even dive in deeper and calculate it for specific meal times like breakfast, lunch, or dinner.
And then, you can use this data to boost your sales in various ways, like with menu engineering.
For instance, if your average check per guest is lower than expected, it could indicate that your customers are not choosing higher-priced items or not adding enough extras to their orders.
You would then use this information to tweak your menu, highlighting your most profitable menu items.
Or, you would leverage unique promotions and appealing discounts during certain times of day when guests spend less, enticing them to add more to their orders with your great deals.
You may wonder how to effectively track the number of guests you serve. Leveraging your POS system is, again, the key here.
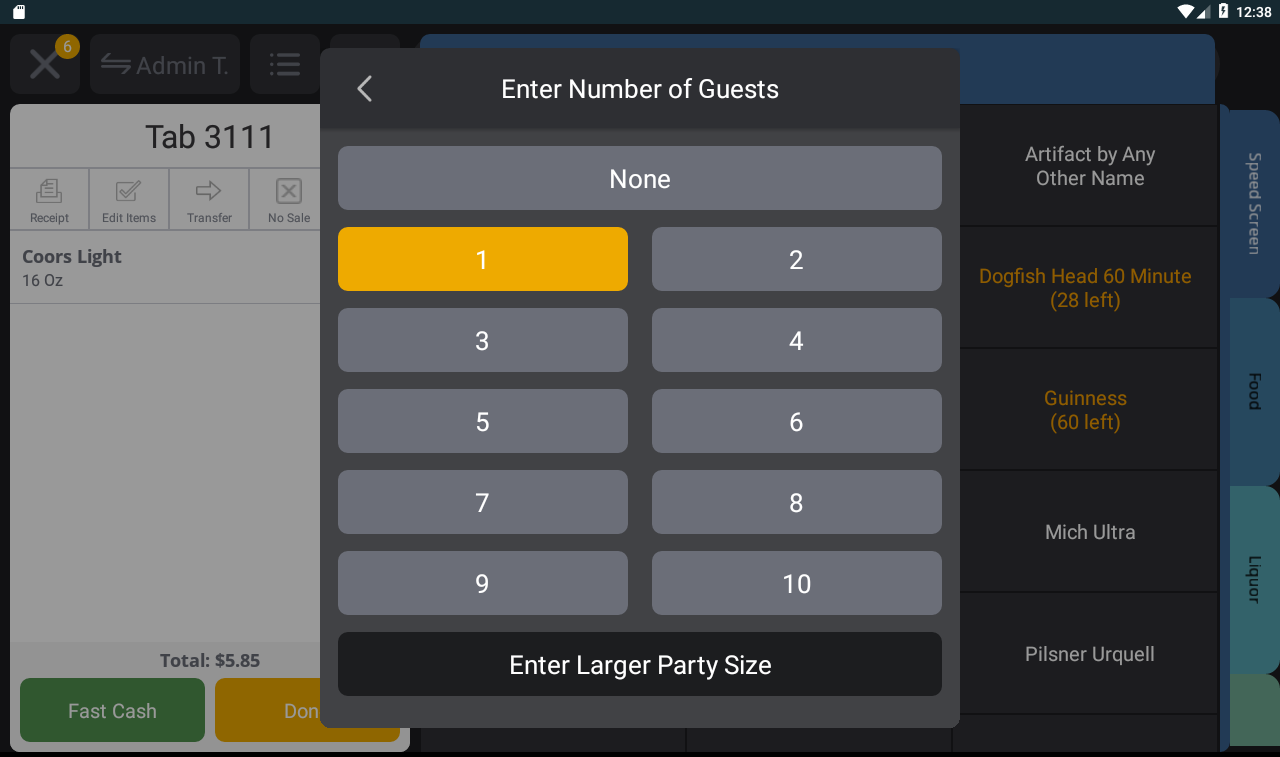
Source: Upserve
Simply put, you should train your staff to accurately record the number of guests they're serving using the built-in features of your POS tool, as shown above.
In conclusion, by using the average check per guest metric, you can tailor your offerings to match your customers' tastes and preferences while also maximizing your revenue.
Sales per Labor Hour
So you've gotten a feel for your sales in relation to your guests, but have you considered your staff's role in this equation?
That's where the sales per labor hour (SPLH) metric comes into play.
This key restaurant sales metric provides insight into how your sales compare to the number of labor hours utilized to generate those sales.
Take a peek at the formula for this calculation below.
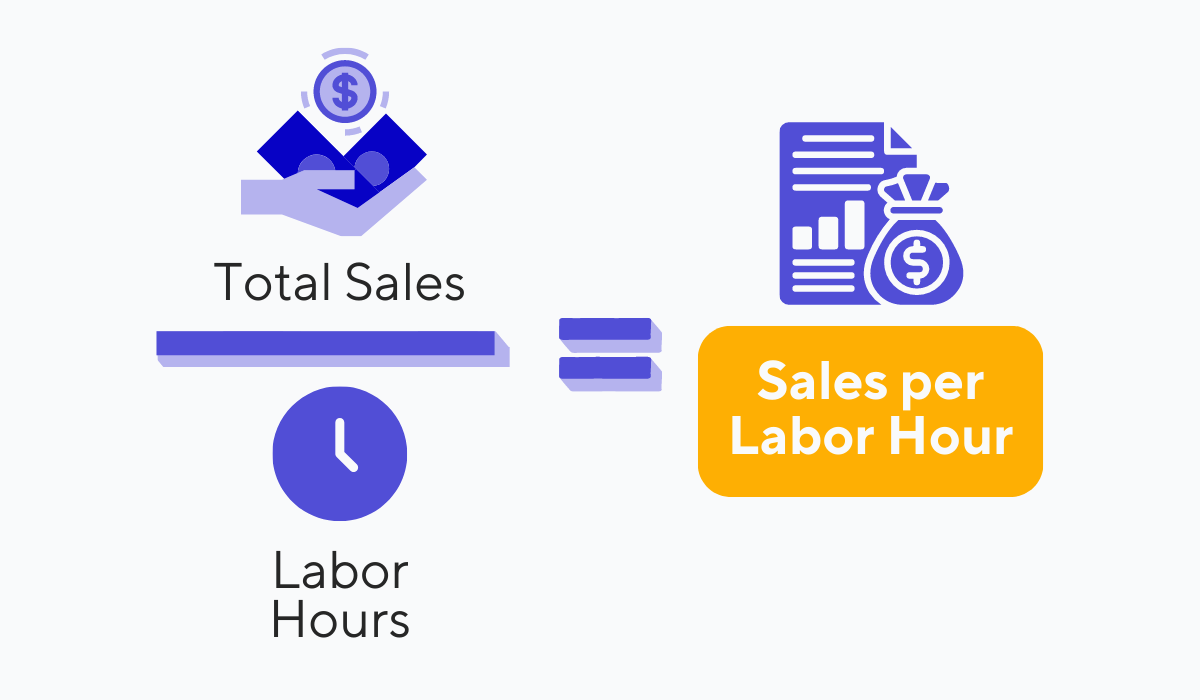
Source: Tablein
The is another straightforward formula, as you should just divide your total sales by the total labor hours, which is the sum of all hours worked by your staff during a given period.
This provides you with an hourly profitability ratio, which is a crucial bit of information for managing your staffing effectively.
As you did with your total sales, you can also compare your SPLH with industry averages for your specific type of restaurant.
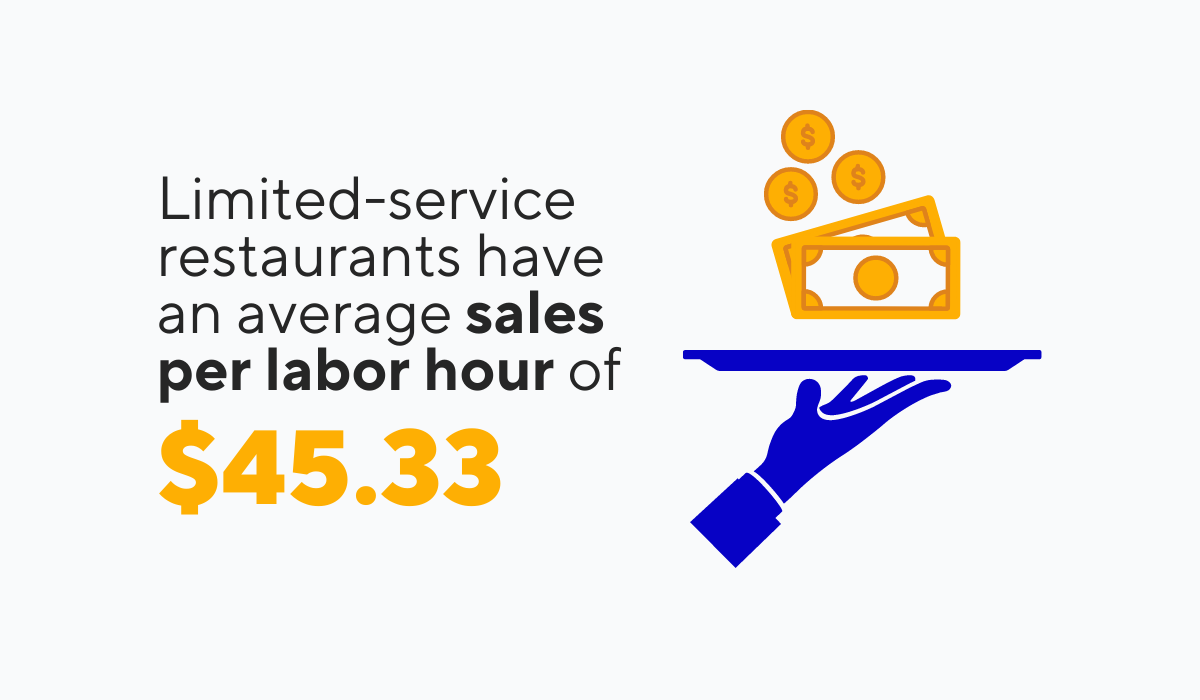
Illustration: Tablein / Data: SynergySuite
For example, a limited-service establishment will typically average around $45 in SPLH, indicating that for each hour of labor, they will generate $45 in sales.
This metric becomes a valuable tool when you're trying to hit your target profits. If your sales forecast is lower than this average, it might indicate that you've budgeted too much for labor.
This can eat into your profits, so you might need to adjust your staffing levels.
To illustrate what we mean, consider the highlighted section in the following image.
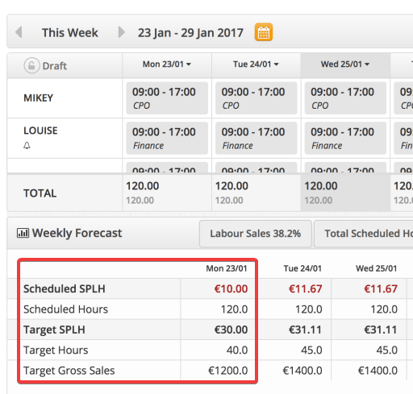
Source: Bizimply
Say your total sales target for Monday was 1200€, and you also scheduled 40 staff hours. This would mean your sales per labor hour is 30€.
However, if you happened to overstaff and schedule 120 hours instead, this would drastically reduce your sales per labor hour to 10€.
What this essentially means is that you make less money for each hour of labor if you have too many staff members compared to your sales.
All in all, by carefully tracking and analyzing your sales per labor hour, you can make informed decisions about staff scheduling and ultimately increase your profitability.
Revenue per Available Seat Hour
Moving from staff to seats, let's delve into an essential restaurant metric that combines both your capacity and sales, known as revenue per available seat hour (RevPASH).
RevPASH is a holistic metric that assesses your restaurant's efficiency by evaluating sales in relation to available seating and operating hours.
To put it simply, it gives you a sense of how well you're utilizing your restaurant's capacity to generate revenue.
Take a look at the formula displayed below to better understand this concept.
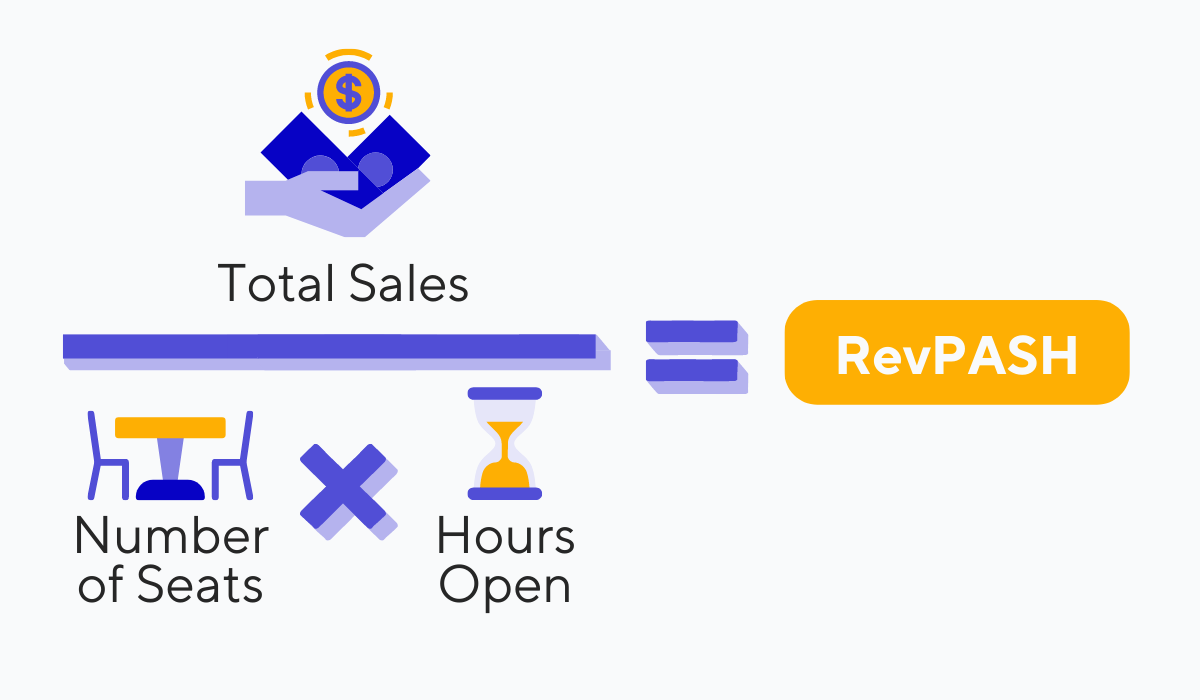
Source: Tablein
Calculating RevPASH involves dividing your total sales for a given period by the number of seats in your restaurant and your operating hours during that period.
This metric is particularly insightful when calculated for specific periods within the day, similar to what was done in the table below.
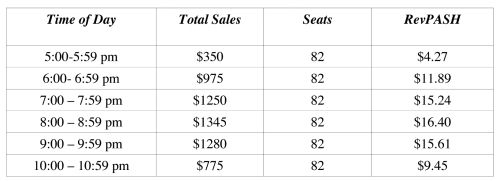
Source: Restaurant Owner
In the provided example, RevPASH is calculated for each hour from 5 p.m. to 11 p.m., clearly showing the revenue efficiency for different times of the day.
Consider a different scenario.
Say a restaurant earns 4,000€ between 11 a.m. and 2 p.m. with 40 seats available, resulting in a RevPASH of 33.33€ (4,000€ / (40 seats x 3 hours)).
Later, between 6 p.m. and 10 p.m., the restaurant makes 5,000€, which translates to a RevPASH of 31.25€ (5,000€ / (40 seats x 4 hours)).
For a restaurant owner, the above example would reveal that despite making more money during the dinner shift, efficiency is higher during the lunch shift.
Such insights could prompt owners to see the factors that could be influencing the metrics, which could be some of the following:
- Average party sizes
- Average dining duration
- Amount of seats
RevPASH offers a comprehensive view of your restaurant's revenue efficiency. It links capacity utilization to sales, serving as a useful tool for operational decision-making.
Table Turnover Rate
The last restaurant sales metric we're going to cover in this article is table turnover.
Table turnover, simply put, is the number of times a restaurant's tables are occupied and cleared during a certain time period.
Now, why is this metric important? High table turnover suggests that your restaurant operates efficiently, swiftly serving and satisfying customers.
On the other hand, low table turnover might indicate slow service and customer dissatisfaction, causing your tables to remain empty for longer.
As a significant factor that affects sales, you need to know how to calculate this vital metric and use your findings to optimize it.
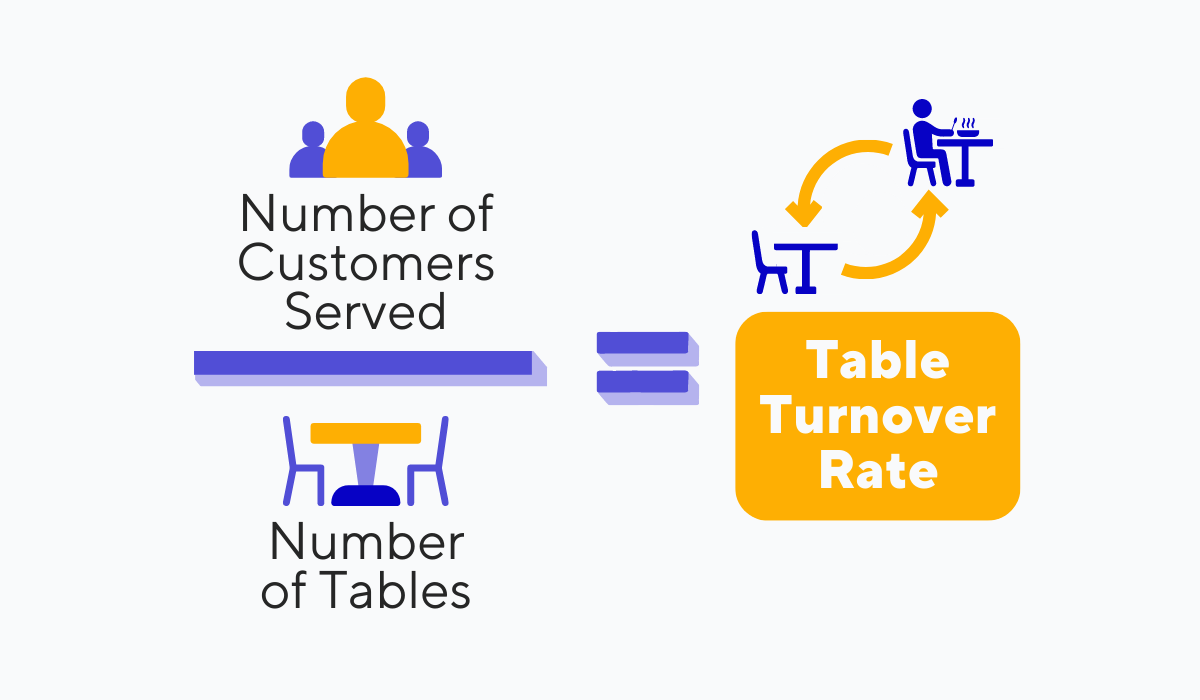
Source: Tablein
Your table turnover rate is calculated by dividing the total number of customers you've served in a given period by the number of tables your restaurant has.
The resulting figure gives an average of how many times each table was used during the calculation period.
It's a critical metric as it can reveal opportunities to optimize your restaurant's operations to serve more customers.
For instance, table turnover really comes in handy when evaluating the impact of any changes to your restaurant operations.
For example, let's say you decided to train your staff on efficient, service-oriented practices designed to quickly serve as many tables as possible.
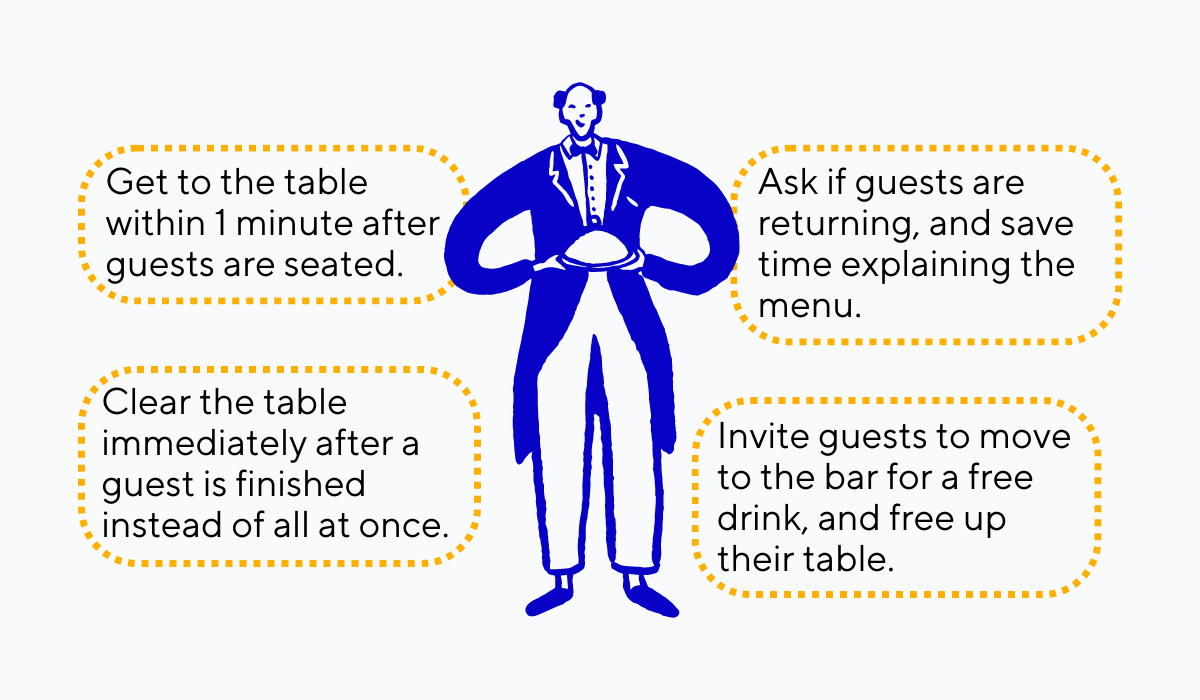
Source: Tablein
The fast serving and clearing of tables could potentially improve your table turnover.
The beauty of this metric is that it provides you with quantifiable data, so you can effectively measure improvements and adjust your strategy accordingly.
Overall, table turnover is an essential metric for optimizing your restaurant operations to increase sales, providing an effective way to gauge service efficiency and customer satisfaction.
Conclusion
In this article, we’ve explored five essential restaurant sales metrics, the key indicators that determine your business' sales success.
Hopefully, we've provided you with the means to assess your restaurant's sales performance.
By tracking and analyzing these metrics, you're equipping yourself with the tools to make data-driven decisions that enhance profitability and streamline operations for your restaurant business.
Remember, running a successful restaurant is about more than just good food. It's about understanding your business from all angles, including the sales numbers.
And with these metrics, you're on your way to achieving just that.
Share this

6 Restaurant Waitlist Metrics You Need to Track

8 Metrics for Tracking the Success of Restaurant Email Marketing