If your restaurant is new, are you on track to surpass the break-even point?
And if you’ve been in the game for a while, is your gross profit margin (above) average?
Do your guests keep coming back, and is your staff at peak performance?
Your answers to these questions are indicative of how well your restaurant fares in this competitive industry.
So, if you want to understand how well your restaurant is doing and what metrics you need to track in order to improve your performance, this article is for you.
Gross Profit
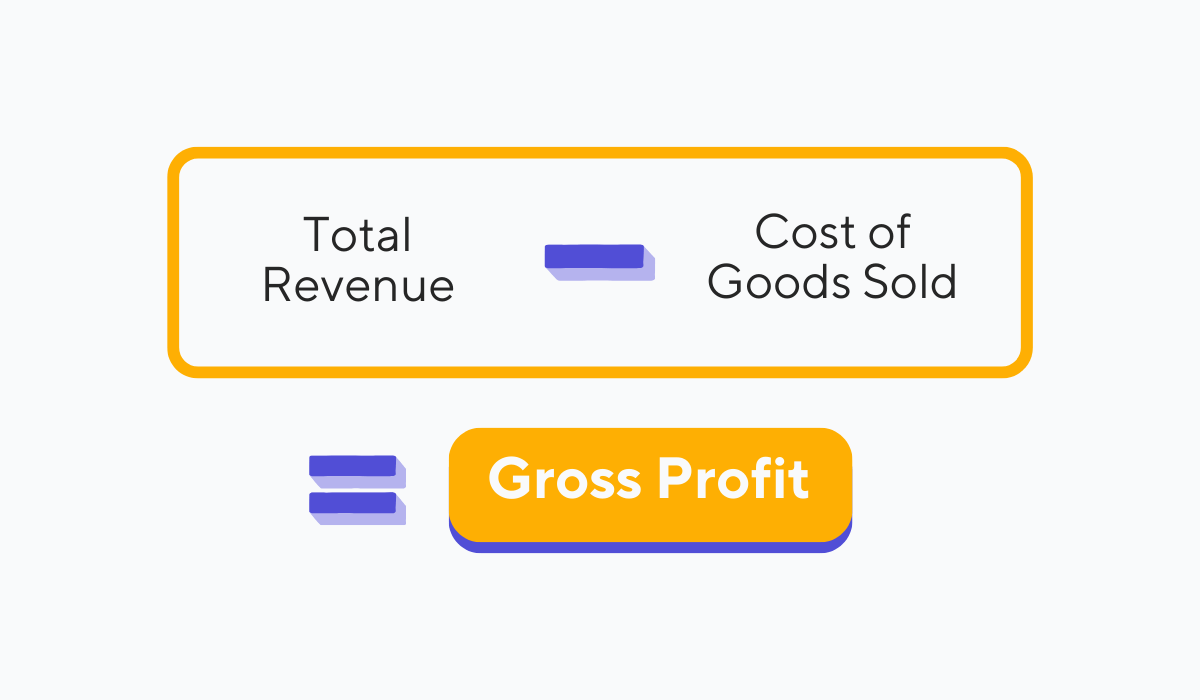
The first performance metric on our list is gross profit.
This metric represents your restaurant's profit after accounting for the cost of goods sold, or COGS, which is the cost required to create your menu items.
Therefore, to calculate your gross profit, all you need to do is subtract the cost of goods sold from your total revenue, like this:
 Source: Tablein
But why is this metric so important?
Simply put, it is because your gross profit tells you how effectively you are running your establishment.
For instance, if your total sales for a specific period of time amount to $17,500, and your COGS is $9,000, this means your gross profit is $8,500, or 48.57%.
For reference, the average gross profit margin that restaurants tend to aim for is 70%.
So, if your gross profit is below that threshold, this is a sign that you might want to revisit your pricing strategies and work on optimizing your menu in order to enhance your restaurant’s profitability.
After all, your gross profit is what makes it possible for you to cover your operating expenses, labor costs, as well as maintenance costs, so realizing healthy profit margins is fundamental.
So, what steps can you take to boost your gross profit margin?
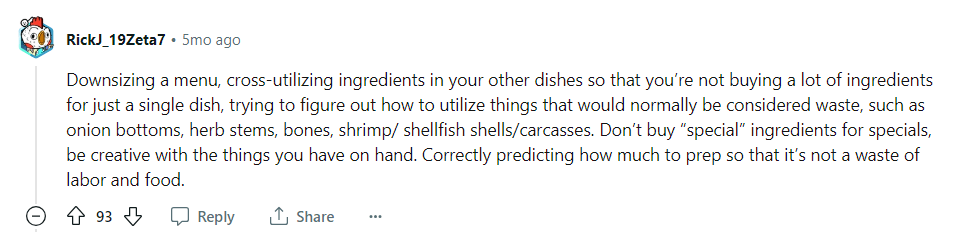
For starters, you can implement strategies to reduce the direct expenses of producing your menu items.
Take a look at some simple suggestions below:
Source: Reddit
If reducing your COGS doesn’t seem possible, you can always apply the principles of menu engineering to drive revenue and push your high-profit, popular dishes.
The bottom line is: understanding how gross profit works and taking the steps to increase your gross profit margin is essential for the optimal performance of your restaurant, so don’t neglect this metric.
Break-Even Point
Even though making a profit is crucial for the success of your restaurant, it is not something that happens overnight.
In fact, it can take several years for your establishment to start making a profit, but there is another goal you need to meet before that happens—you need to break even.
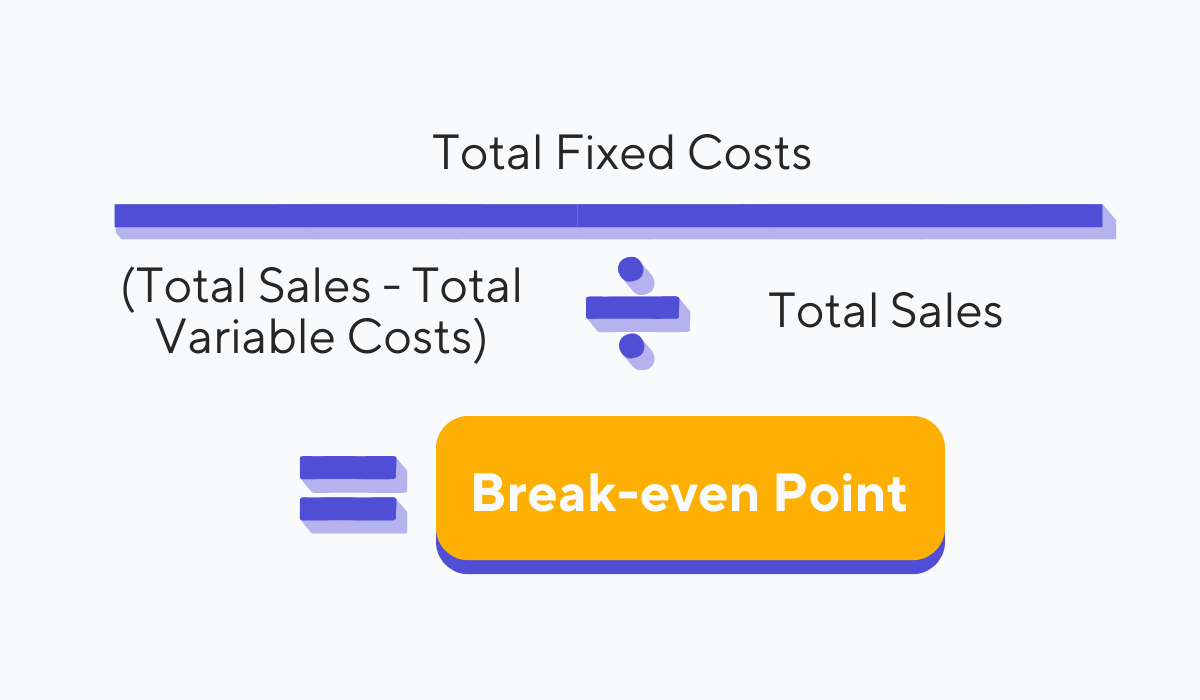
The break-even point is the point where your restaurant’s total revenue is equal to its total cost.
In other words, it is the moment in which your total sales cover all your fixed and variable costs, meaning that you’re neither realizing a profit nor losing money.
Your break-even point can be calculated using the formula below.
Source: Tablein
Calculating and analyzing this metric is going to help you gain a clearer understanding of how much revenue your restaurant needs to generate in order to keep your operations running.
With this information on hand, you can start setting realistic financial goals for the future and slowly take the steps necessary to surpass the break-even point and start generating profits.
- What areas could you reduce your costs in?
- Is there a way for you to improve your operational efficiency?
- How can you increase your sales to achieve profitability?
Analyzing your break-even point can help you answer these important questions, so don’t ignore it.
Table Turnover Rate
The next performance metric on our list—instrumental for measuring the operational efficiency of your restaurant—is the table turnover rate.
This metric measures how quickly your tables get cleared and prepared for the next group of guests.
You can calculate it using the following formula:
Number of Parties Served ÷ Number of Tables = Table Turnover Rate
Just like the gross profit, table turnover rate is one of those metrics you want to keep high, as having your tables unoccupied for too long is bound to negatively affect your revenue.
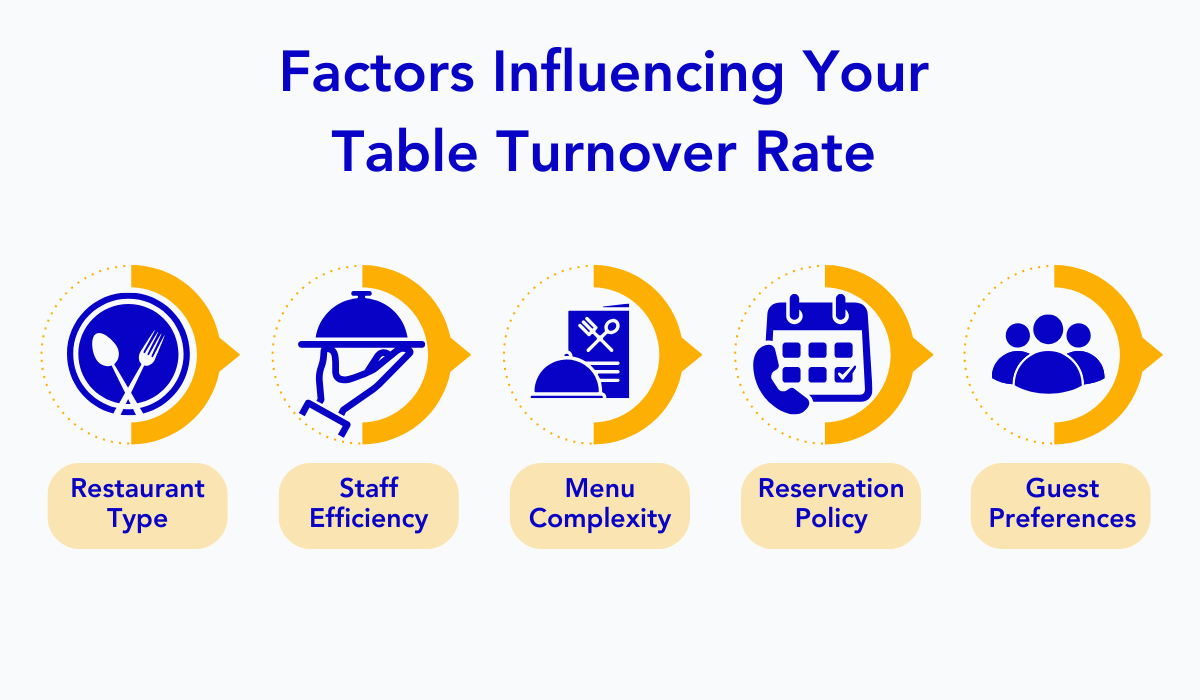
But what factors can influence your restaurant’s table turnover rate?
We listed several key ones in the image below.
Source: Tablein
A high table turnover rate indicates that your restaurant’s operations are efficient, your staff well-coordinated, and your seating capacity maximized.
Keep in mind, though, that this should never be achieved at the expense of guest satisfaction.
In other words, you never want to compromise food quality or create a rushed dining experience for the sake of turning more tables.
The goal is to achieve a balance between increasing your turnover and thereby boosting your restaurant’s overall performance, and meeting the needs and expectations of your guests.
This is often easier said than done, which is why we have dedicated an entire article to our best tips for increasing your restaurant’s table turnover without compromising the guest experience.
Time per Table Turn
Time per table turn is a performance metric related to, but not to be confused with the table turnover rate we discussed above.
Time per table turn indicates how long, on average, guests occupy a table before it is turned over to the next party.
This is one of the restaurant performance metrics that don’t require a specific formula—all you’re going to need is data from your POS system.
Namely, modern POS devices have a time-tracking feature that will provide you with timestamps for specific events in the dining process.
You’re going to be looking at two timestamps in particular: when the server put in an order, and when the guests paid for it and left.
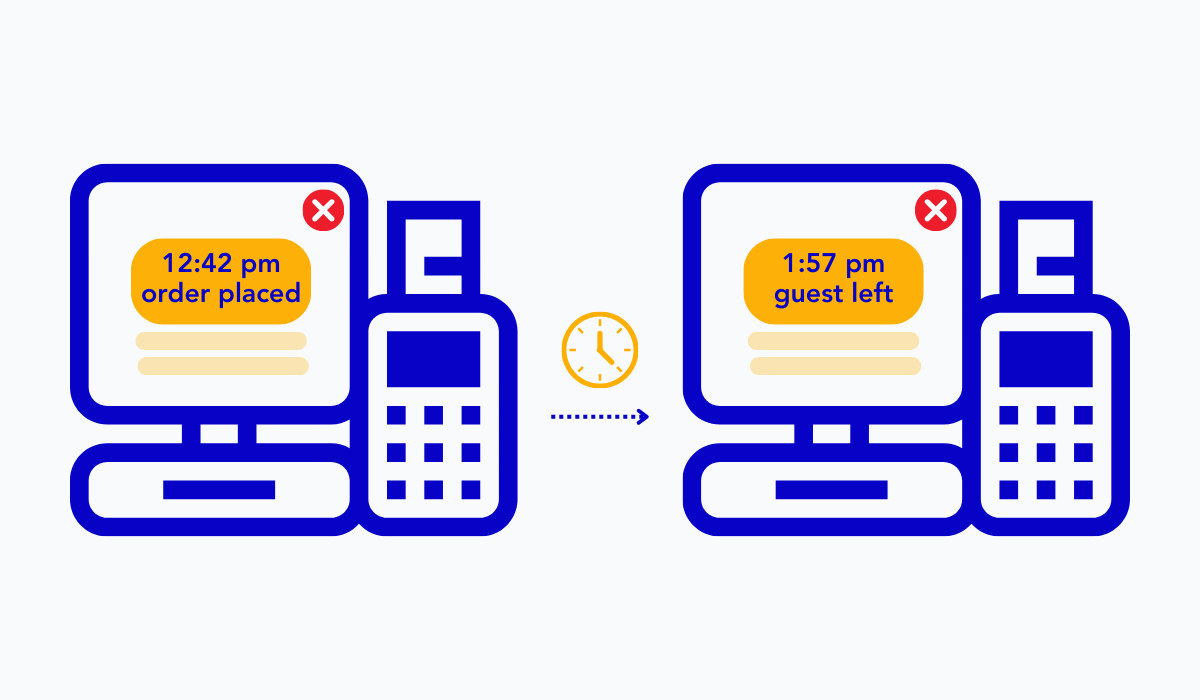
Source: Tablein
The average amount of time that you get using this approach represents your time per table turn.
This metric is extremely useful for identifying operational bottlenecks and implementing tactics that will help you fix them.
For instance, if the data collected by your POS system shows that the amount of time between the order being placed and the food being served during lunch hours is longer than you’d like it to be, this could be indicative of an efficiency issue in the kitchen.
Talk to your staff to get to the bottom of the issue.
Are you perhaps understaffed during lunchtime, or is your staff reporting a delay in communication between the front and back of the house?
These are challenges that can easily be overcome by tweaking the schedule or investing in a solution like a kitchen display system.
But to do that, you need to be aware that the issue exists in the first place, so pay attention to your time per table turn.
Average Customer Headcount
Average customer headcount is the next important performance metric every restaurateur needs to keep an eye on.
This metric tells you how many guests you served during a specific period of time, thus helping you get an idea of the popularity of your establishment.
Apart from that, the average customer headcount metric can be used to better anticipate and prepare for busy or slower periods.
If you want to check how many customers you’ve served in a specific timeframe, your POS system can provide you with that information.
Alternatively, you can turn to your restaurant booking system for this data.
Tablein is an example of a restaurant reservation software with a data-rich reporting feature that tells you exactly how many guests you have served during a certain period.
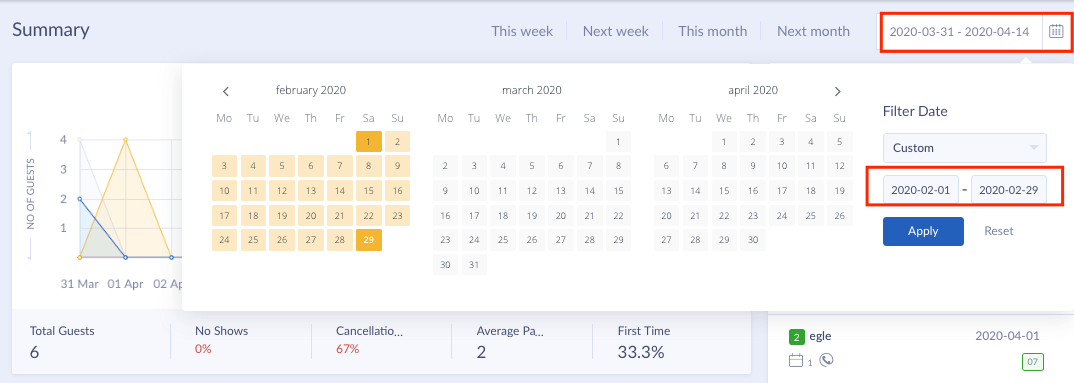
Source: Tablein
If you notice that your lunch hours during the weekend have a higher customer headcount than the same hours during weekdays, you can use these insights to adjust your staffing levels.
That way, you won’t have too few staff members rushing to clear tables and serve guests during those busy hours, thereby negatively affecting your table turnover and the guest experience.
Additionally, you can introduce weekday lunchtime promotions to drive business during slower hours.
All in all, understanding your customer headcount patterns can help you improve your restaurant’s performance, making it one of the key metrics to track.
Item Repeat Purchase Rate
Apart from keeping track of how many guests you serve during a specific period and how long they tend to occupy a table, you also want to track your item repeat purchase rate.
This metric is most commonly used in eCommerce to measure customer loyalty and is defined in the following way:
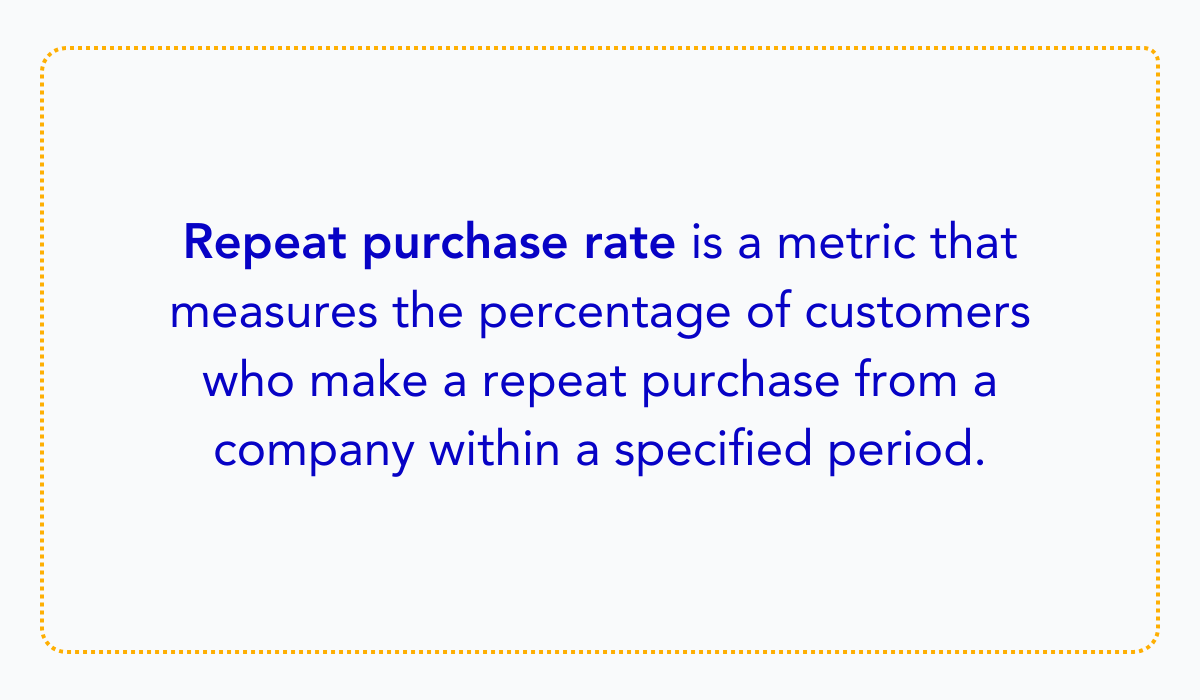
Illustration: Tablein / Data: FigPii
However, this metric can be extremely helpful for you as a restaurateur, too.
Namely, measuring repeat purchases is used in the restaurant industry to gauge the popularity of menu items.
Simply put, you can determine what menu items are worth focusing on the most based on how frequently your guests come back to your restaurant for them.
For example, the Subway franchise often shares this information with the public on their social media. So everyone knows which sandwiches and sauces are the most popular.
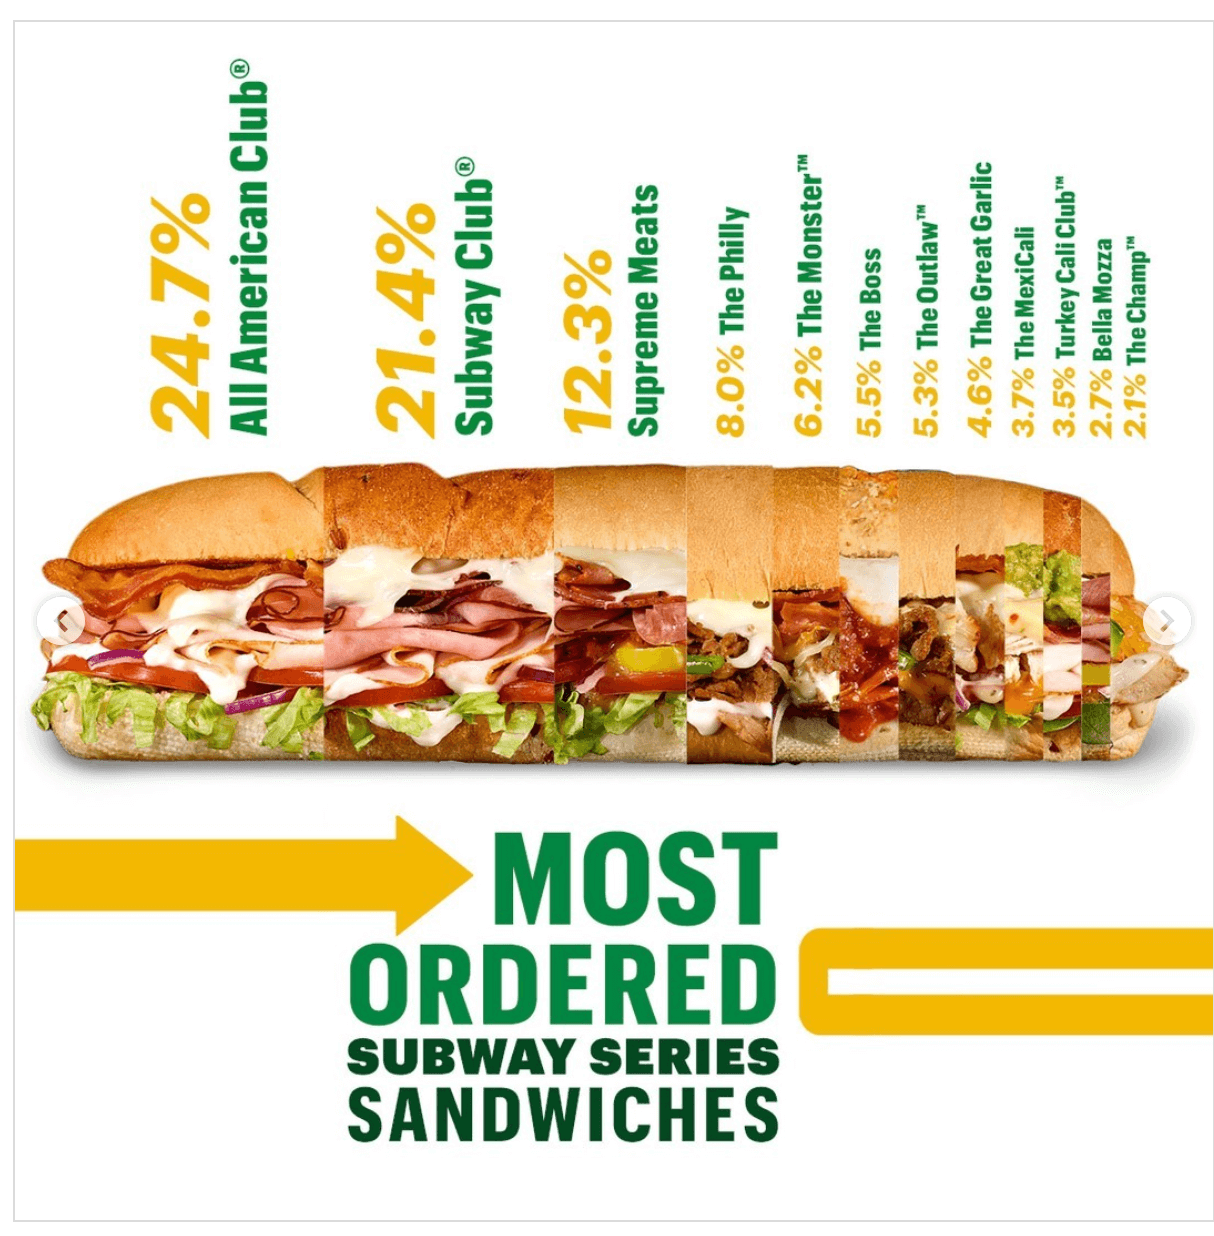
Source: @Subway
To calculate the item repeat purchase rate, you can use the formula below.
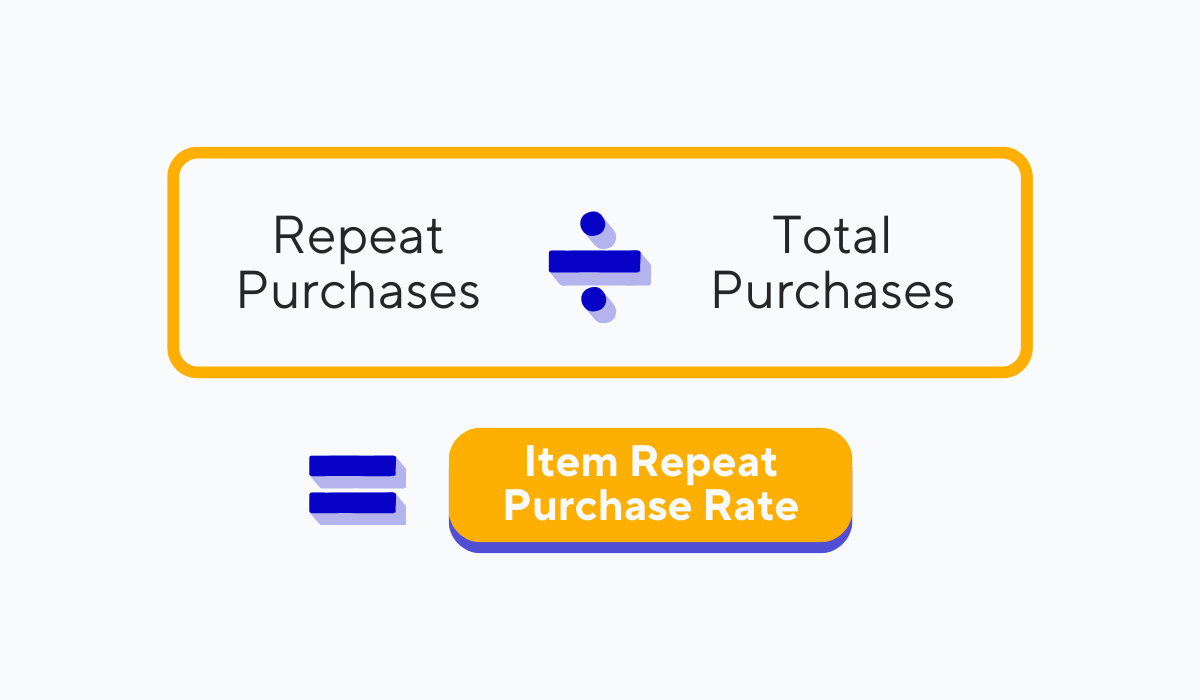
Illustration: Tablein / Data: Apicbase
Once you have an idea of what dishes on the menu are your guests’ favorites, the possibilities for using this data to boost your restaurant’s performance are nearly endless.
For example, you can use the repeat purchase rate metric to plan your inventory with more accuracy and make sure you’re never under- or overstocked on ingredients.
Alternatively, you and your staff can come up with ideas on how to use these popular items for upselling and cross-selling, thus increasing the overall order value and your profitability.
By monitoring this metric, you can develop new, data-driven strategies that will contribute to your restaurant’s performance, so make the most of it.
Customer Retention Rate
Another guest-related performance metric to pay attention to is the customer retention rate.
While the item repeat purchase rate tells you how loyal your guests are to specific menu items, the customer retention rate measures your guests’ loyalty to your restaurant.
You can calculate it using this formula:
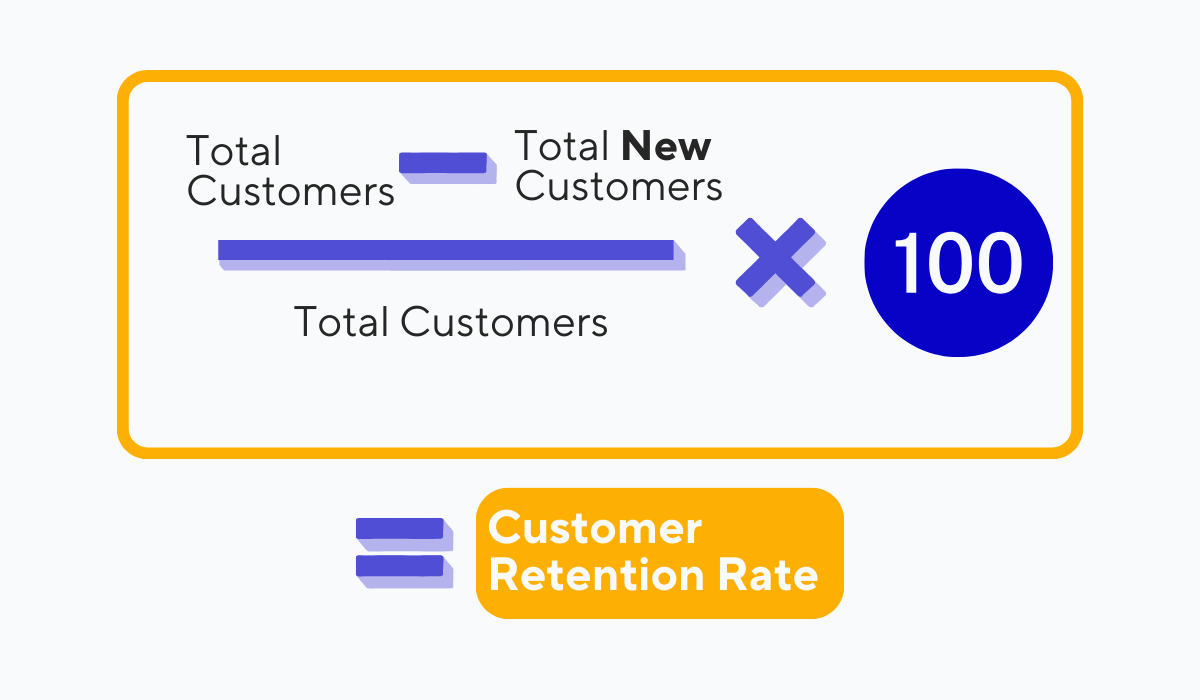
Source: Tablein
According to Statista, the average customer retention rate for restaurants sits at 55%, which is fairly low compared to other industries.
On top of that, attracting new guests can be quite expensive and time-intensive, as it involves significant marketing expenses and quite a bit of trust-building in order to turn them into repeat customers.
This makes keeping an eye on and increasing your retention rate that much more important.
So, what can you do about it?
In the simplest terms, you need to focus on building strong relationships with your guests.
For instance, you can create and promote a loyalty program where each visit earns your guests points redeemable for personalized discounts or exclusive perks.
This will create a sense of exclusivity and inspire your guests to come back time and time again.
Jon Taffer, a restaurant entrepreneur and TV personality, explains:
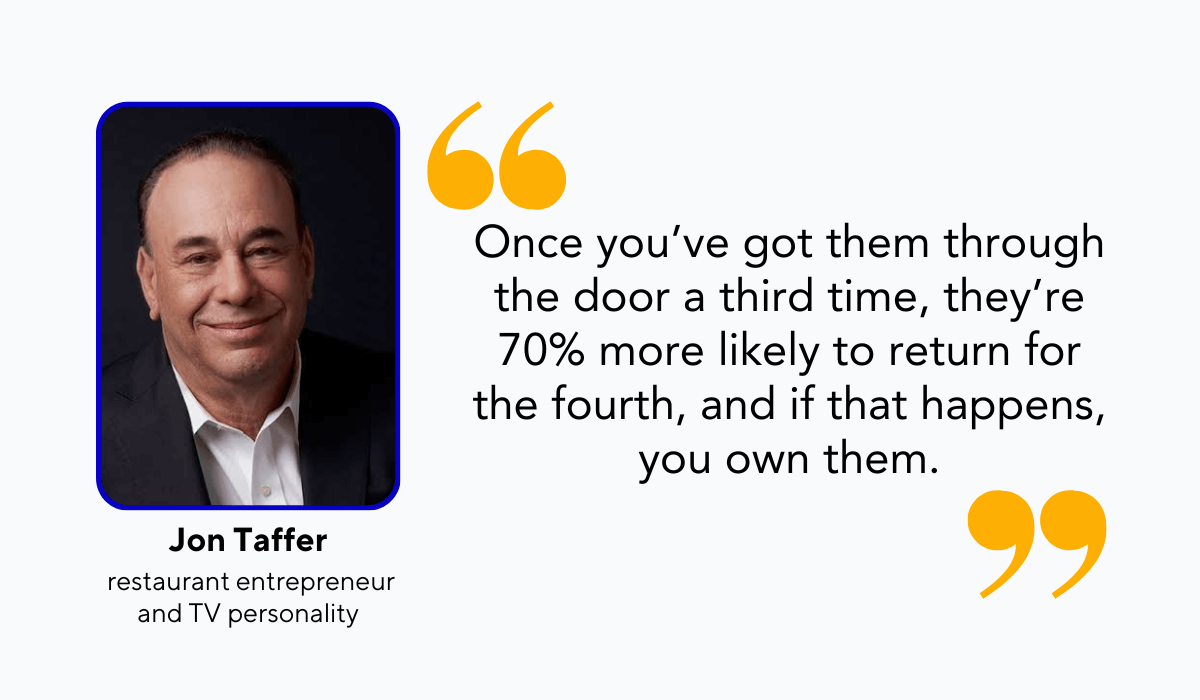
Illustration: Tablein / Quote: Beambox
We believe it is safe to say that your customer retention rate is one of the most important metrics to track, as it directly affects your restaurant’s performance.
So invest in it, and watch your establishment thrive.
Employee Turnover Rate
Employee turnover rate is a metric that tells you what percentage of employees leave your restaurant within a specific timeframe.
Keeping your employee turnover rate low is crucial for the success and performance of your restaurant, but this is also easier said than done.
Namely, Toast reports that “as of January 2024, the average annual restaurant industry turnover rate is 79.6% over the past 10 years.”
But why is the employee turnover rate so high in the restaurant industry?
Here are some of the top reasons:
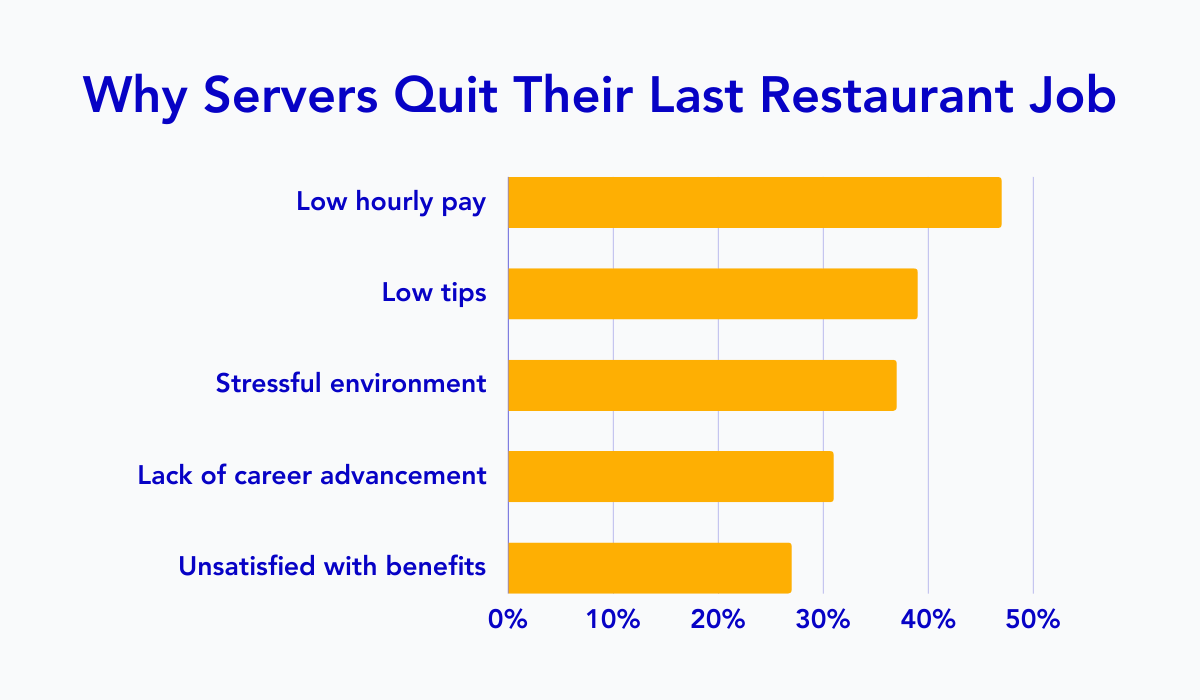
Illustration: Tablein / Data: Software Advice
To see how your restaurant fares when it comes to this important metric, use the following formula:
(Employees Departed ÷ Number of Employees) × 100 = Employee Turnover Rate
Now, if you find that your employee turnover rate is high, it is time to take a step back and identify the factors that might have contributed to this.
Talk to your employees about what steps you can take to not only retain them, but also keep them happy and motivated.
Take their feedback seriously and try to implement it to the best of your ability.
At the end of the day, dealing with high turnover isn’t only costly—it also affects your service quality and customer satisfaction, which can make or break the performance of your restaurant.
Labour Productivity
The final restaurant performance metric on our list today is labor productivity.
As the name suggests, this metric measures the efficiency and effectiveness of your workforce, and you can track it company-wide or on an individual employee level.
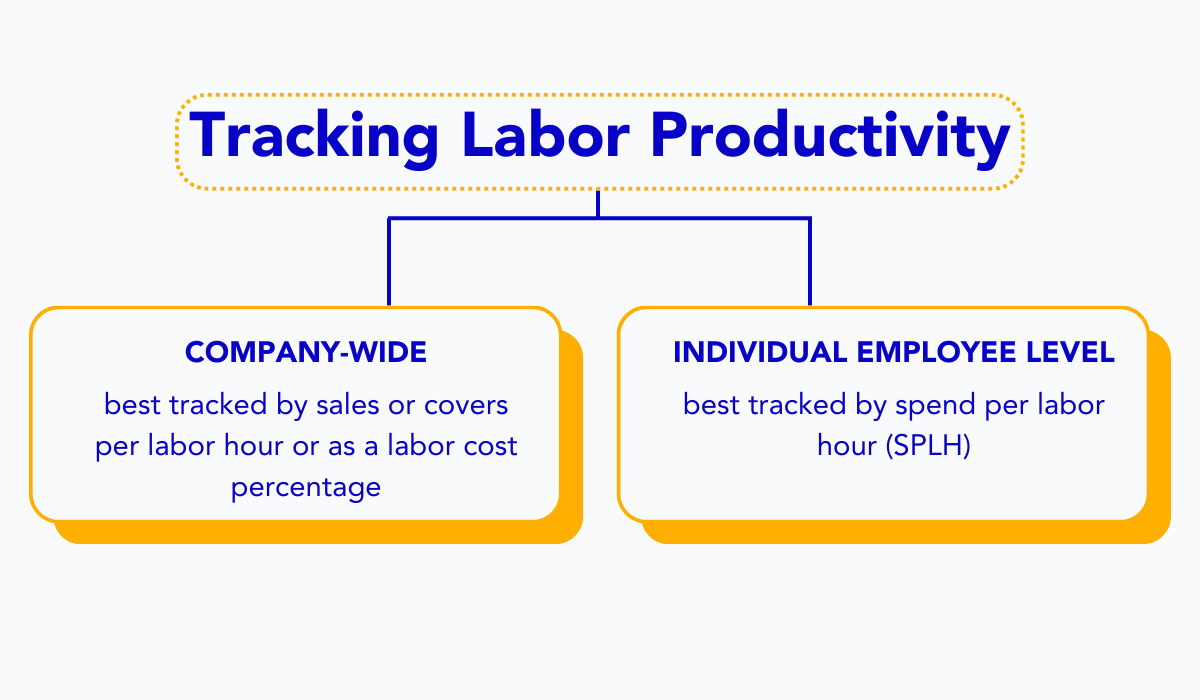
Illustration: Tablein / Data: Tenzo
It goes without saying that keeping this metric high carries a lot of importance for the success of your restaurant.
To achieve this, make sure to regularly monitor the performance of both individual employees and the team as a whole.
That way you’ll be able to identify what steps you can take to utilize your resources more effectively and increase the profitability of your operations.
- Have you invested enough in staff training and cross-training, allowing your employees to take on various tasks successfully?
- Have you implemented technology into your daily operations that can improve productivity?
- Do you make it a point to foster a positive work culture where your employees feel motivated to be efficient?
If you answered “no” to any of these questions, it might be time to reevaluate your approach and identify areas of improvement.
After all, the performance of your restaurant largely hinges on the performance of your employees, so make an effort to create a culture where they feel inspired to perform well.
Conclusion
And with that, we conclude our list of the most important performance metrics every restaurateur should track.
As you can see, a lot goes into building a successful restaurant business: from making sure you’re on track to achieving profitability, to building relationships with your guests and maintaining productivity among your staff members.
Although tracking all of the metrics we presented in this article may seem like a lot of work on top of everything else you’ve got going on, we believe it’s worth the effort.
Keeping an eye on performance metrics has the power to significantly improve your business, so don’t underestimate this important activity.
Share this

8 Best Restaurant Reservation Systems

11 Types of SMS Your Restaurant Should Send