Your first thought might be sales and profits and maybe the number of patrons regularly visiting your establishment.
Yet, there's more to the story. Beyond the obvious indicators, there are numerous other metrics, known as Key Performance Indicators (KPIs), that can give you a more nuanced understanding of how your restaurant is doing.
In this article, we'll dive into 12 essential KPIs you should track. Trust us, you'll want to pay attention, as these KPIs can reveal the health of your business and help you avoid problems before they escalate.
Let’s jump right in.
Table of contents
- Cost of Goods Sold
- Food Cost Percentage
- Labor Cost Percentage
- Prime Cost
- Overhead Rate
- Break-Even Point
- Gross Profit
- Net Profit Margin
- Table Turnover Rate
- Average Check Size
- Average Cover
- Total Sales by Server
- Conclusion
Cost of Goods Sold
If your goal is optimizing your inventory management, understanding the cost of goods sold (CoGS) is essential.
This KPI refers to the costs associated with producing food and beverages in your restaurant for a specific period of time.
For example, for a single chicken dish, this metric will incorporate everything from the cost of the poultry and the vegetables down to the herbs and cooking oil you had to purchase.
As such, it can provide insights into how well you manage your inventory and where you might be spending too much money, helping you price your menu items more accurately to maximize revenue.
The image below shows how to calculate CoGS.
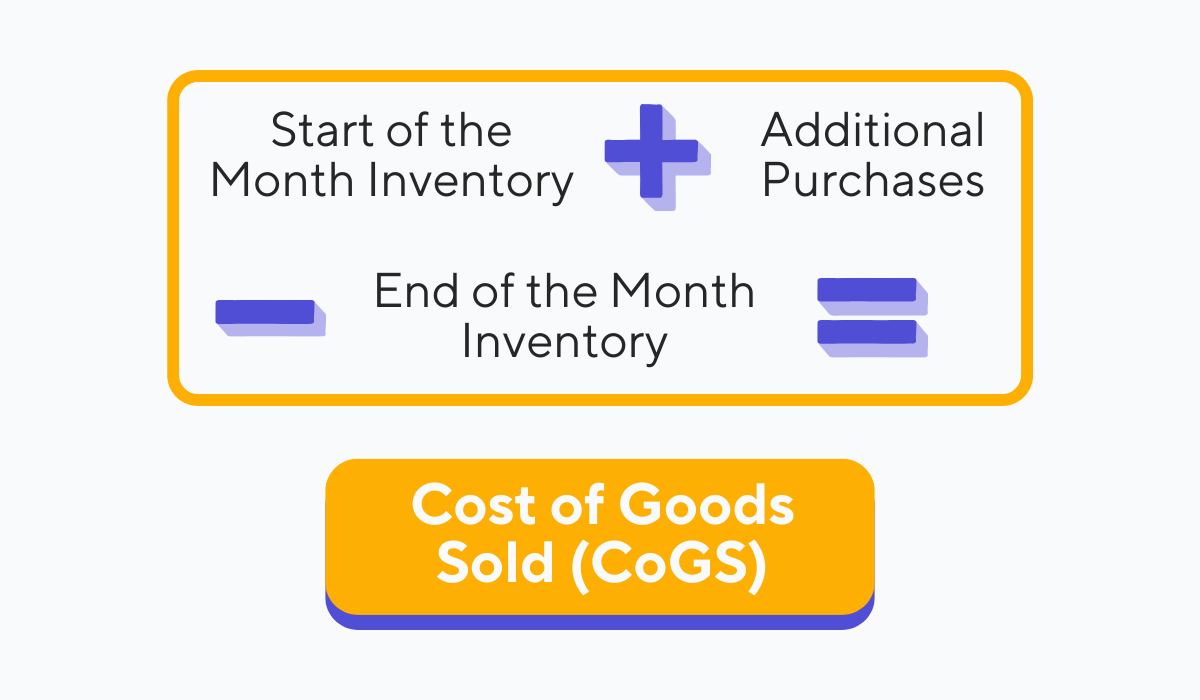
Source: Tablein
To illustrate, say you started the month with an initial inventory value of $5,000, made extra purchases of $2,000, and ended the month with $3,000. Your CoGS would be $4,000, meaning that that’s the amount you spent on inventory.
This performance indicator can provide you with key insights into where you’re spending your money, so calculating it is a must.
Food Cost Percentage
Now that we have the broad numbers, you might want to break it down to specifics. That’s where food cost percentages come into play.
By calculating the food costs for each specific menu item, you essentially assess their cost-effectiveness and ensure you are keeping your pricing strategy in check.
That’s achieved through calculating what percentage of the selling price of the item is spent on ingredients.
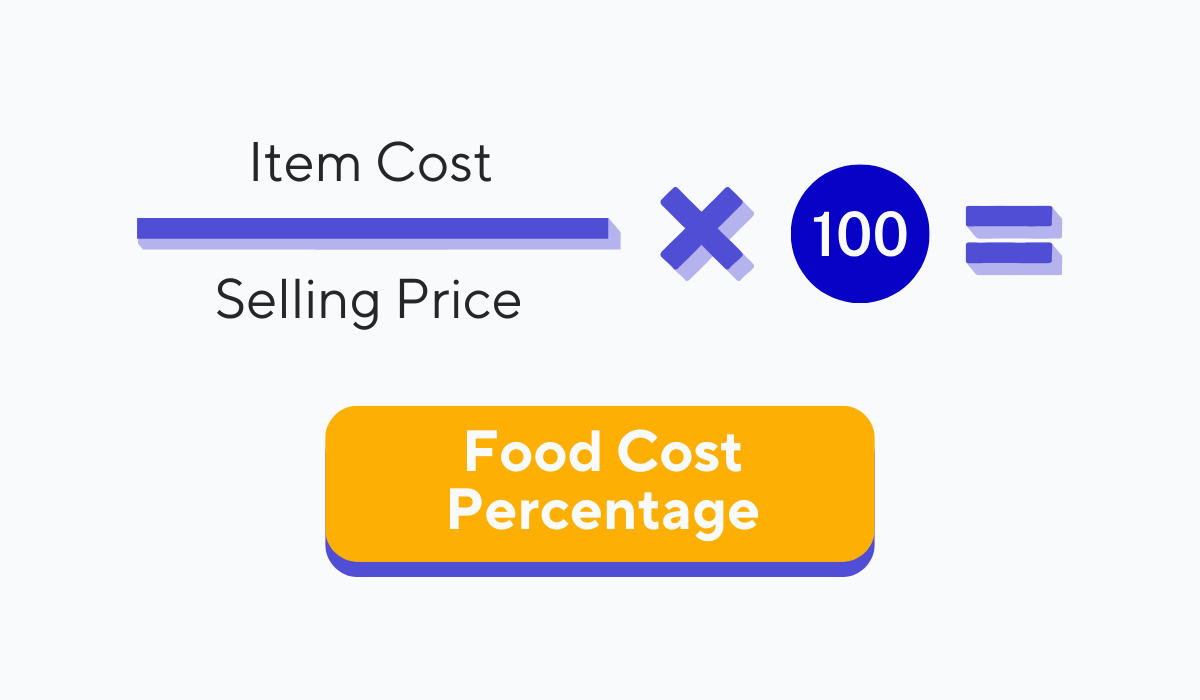
Source: Tablein
Using the formula shown above, if a dish costs $5 to make and is priced at $20, the food cost percentage would be 25%.
As one Quora user below puts it, this percentage would be acceptable, as you generally want your food cost percentages at or lower than 30%.
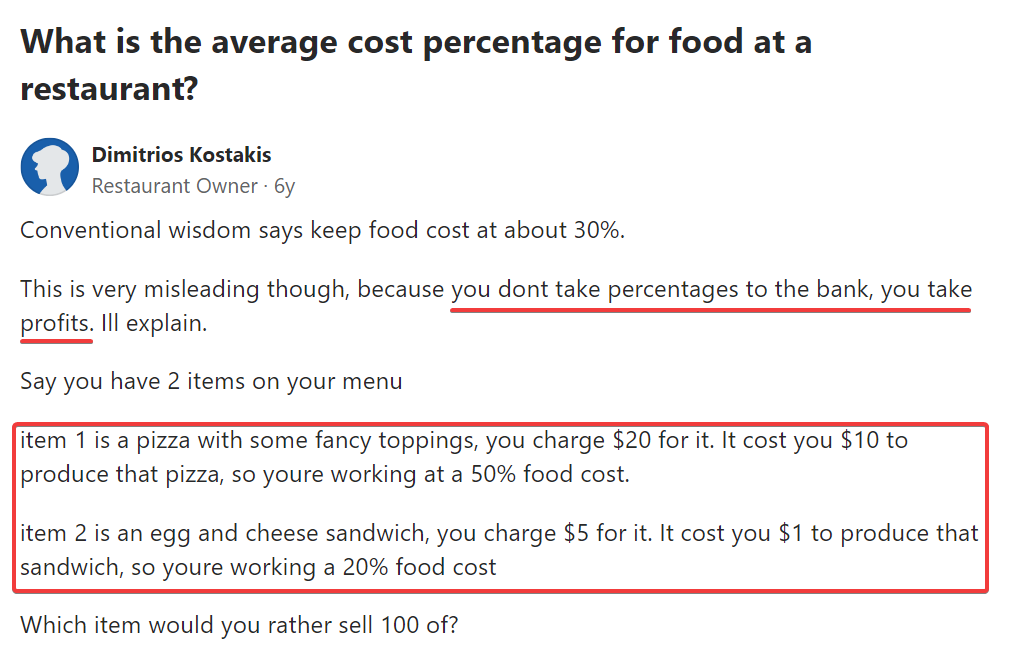
Source: Quora
However, consider the item’s profits as well. A higher percentage doesn’t mean an item doesn’t bring you profits, as the example above illustrates.
Nevertheless, this KPI is a crucial check of your menu profitability.
Labor Cost Percentage
Our third KPI checks how you handle one of your most significant expenses—your staff.
This metric is crucial for effectively handling your staffing needs and budgeting, as it indicates what percentage of your total sales goes toward staff salaries, benefits, and other staff-related costs.
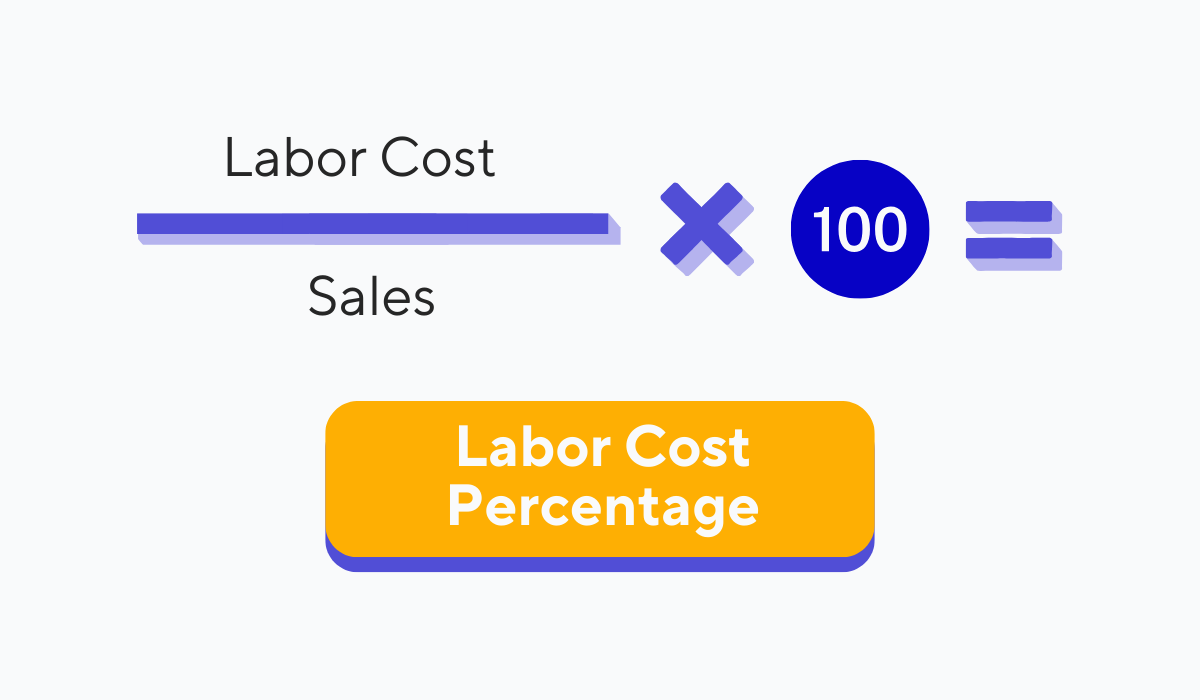
Source: Tablein
For instance, if your total monthly sales were $20,000, and the money you spent on your staff was $8,000, the labor cost percentage would be 40%. You could then compare this percentage to what an average percentage might look like, which is around 25-35%.
A much lower percentage would indicate you are understaffed and your staff is overworked, while a higher percentage might mean either you overstaff your shifts or the staff is inefficient and in need of training.
In any case, this key performance indicator will allow you to make adjustments accordingly.
Prime Cost
Next up is a more comprehensive KPI that combines two of your highest expenses.
Your prime cost is the sum of your CoGS and your total labor costs, and it is an indicator of how effectively you manage both your inventory and staffing costs.
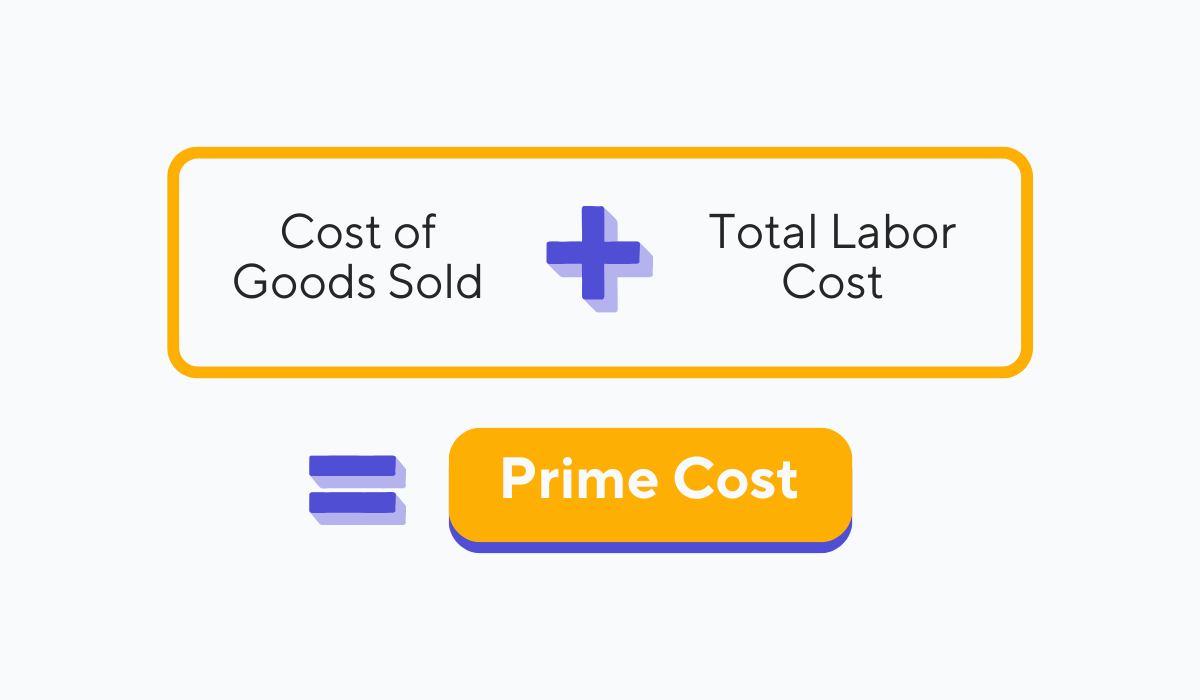
Source: Tablein
The formula shown above is very straightforward as it simply combines two other metrics. But why calculate prime cost when you can simply track these other two KPIs?
Well, it can paint a clearer picture of your main costs than viewing them separately, giving you a comprehensive snapshot of the resources it takes to generate your revenue.
Say you made staff changes that reduce labor costs. This change could, in turn, increase CoGS due to a difference in service efficiency and inventory wastage.
So, your total labor cost would be lower, but your prime cost would stay the same.
By monitoring your prime cost, you get a consolidated view that can be very useful for strategic planning.
Overhead Rate
Let’s now turn to the fixed costs of running a restaurant.
These are your overhead costs, and while they don’t directly contribute to the cost of dishes, they are still expenses you must regularly face.
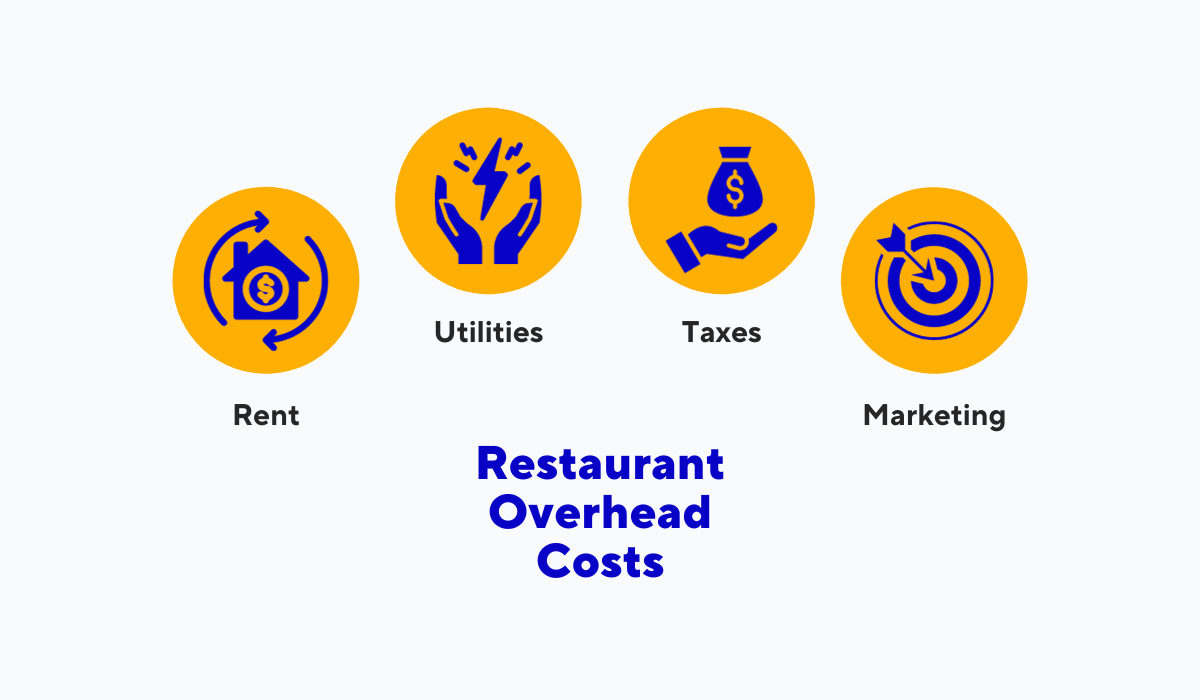
Source: Tablein
Some of these overhead costs are illustrated above.
To calculate your overhead rate, you’ll need to use the formula shown next. In the formula, the term "cost driver" represents an activity or metric you need to calculate your overhead rate.
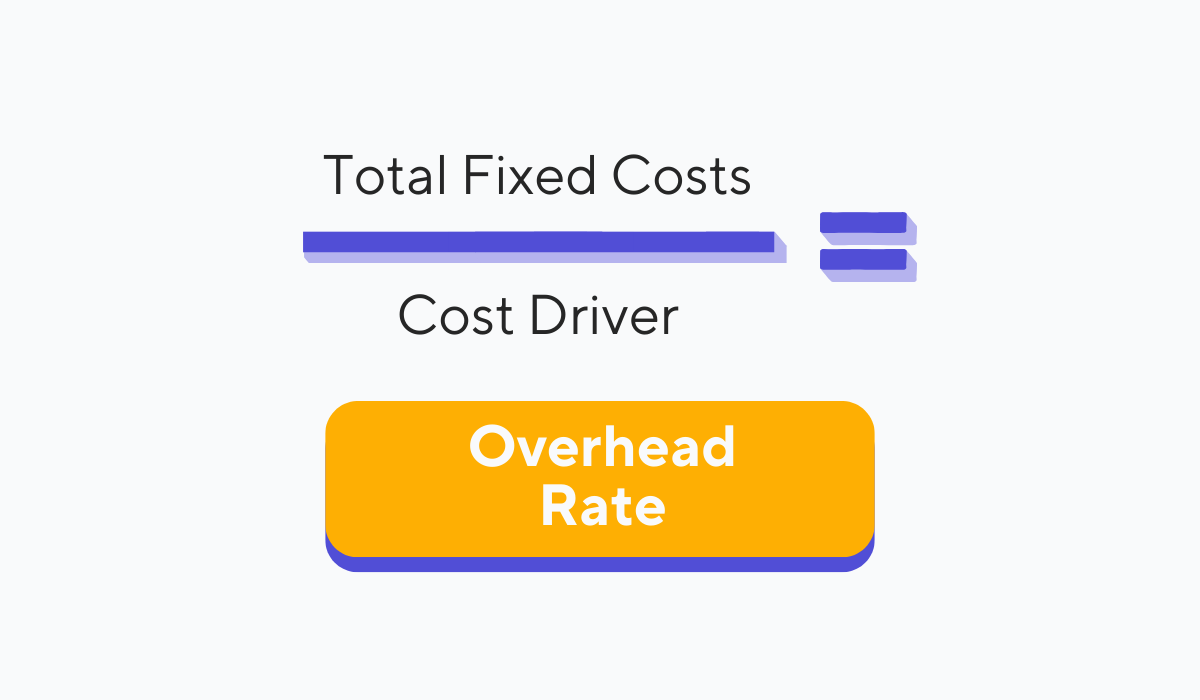
Source: Tablein
Cost drivers could be things like the number of meals served, the square footage of your restaurant, or even the number of employees. It all depends on the type of restaurant you’re running.
As an example, say you had $8,000 in fixed costs, and you chose meals served as your cost driver, which amounted to 2,000 in a given month. Your overhead rate per meal would be $4.
This value is extremely important as it can guide menu pricing decisions, ensuring your prices account for all expenses and still bring in profit.
Break-Even Point
Next up is the break-even point, an indicator for predicting when your restaurant will start making profits.
Running a restaurant is no easy task and, as the Reddit comment below nicely puts it, you can expect your restaurant to bring in no profits at all for the first couple of years.
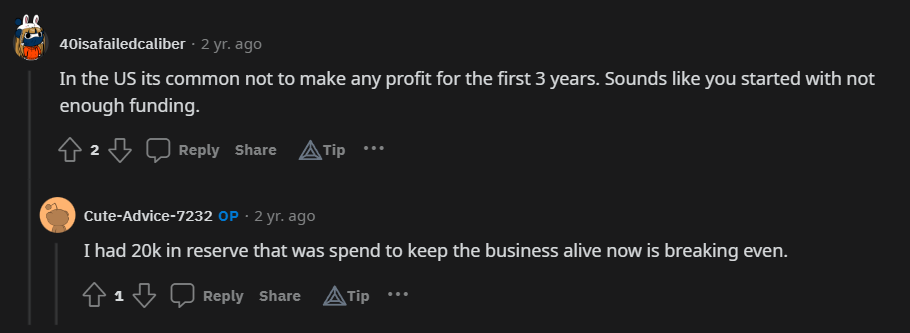
Source: Reddit
To ensure your restaurant doesn’t fail at the very start, you need to have enough resources in reserve to keep the business running and wait for the crucial break-even point.
This point is the moment your restaurant’s total revenue equals your total costs, resulting in neither profits nor, more importantly, losses. Any additional revenue after this point is all profits.
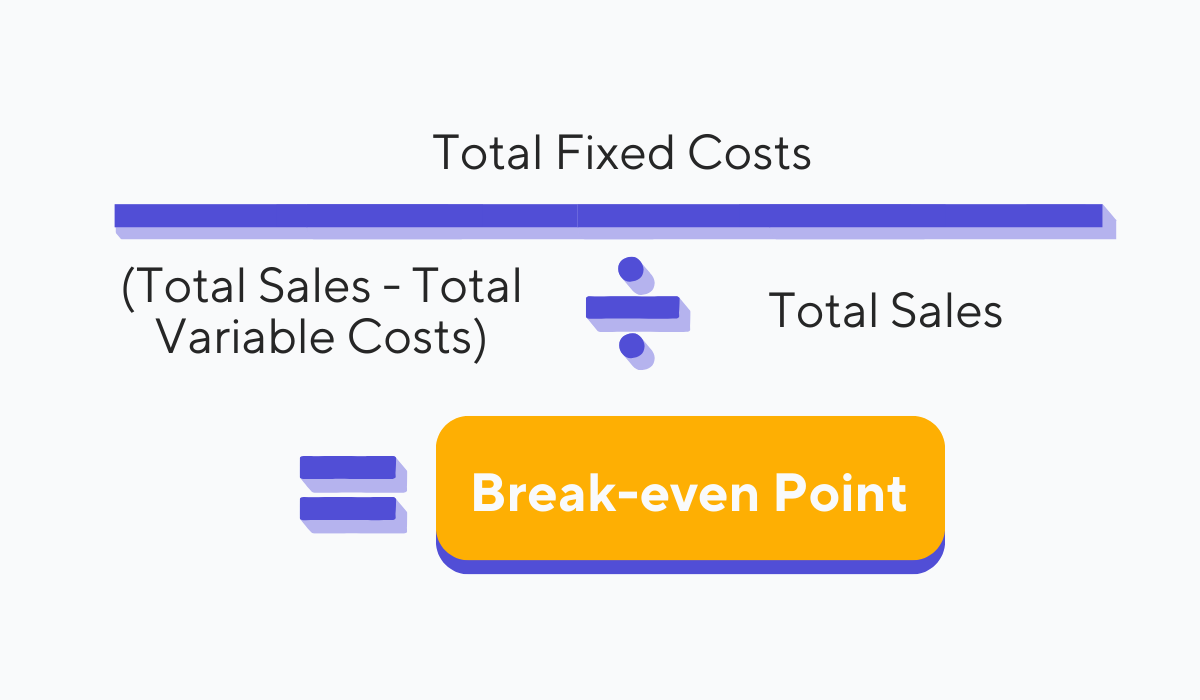
Source: Tablein
The image above shows the formula that you need to use to calculate this KPI. As you can see, you need to factor in your fixed and variable costs, along with your total sales.
Calculating your break-even point helps you set realistic financial goals and timelines. It gives you a clear target to aim for and helps you understand how changes in costs or sales will affect your profitability.
Overall, it’s a necessary thing to calculate and use to track your progress.
Gross Profit
Your gross profit is another fundamental KPI that provides a snapshot of your restaurant's financial health.
It indicates your restaurant’s profitability and how well you’re managing your costs and inventory relative to your revenue.
Essentially, it tells you how much money is left after you've paid for all the raw materials and direct labor involved in food preparation.
It’s calculated using the following formula.
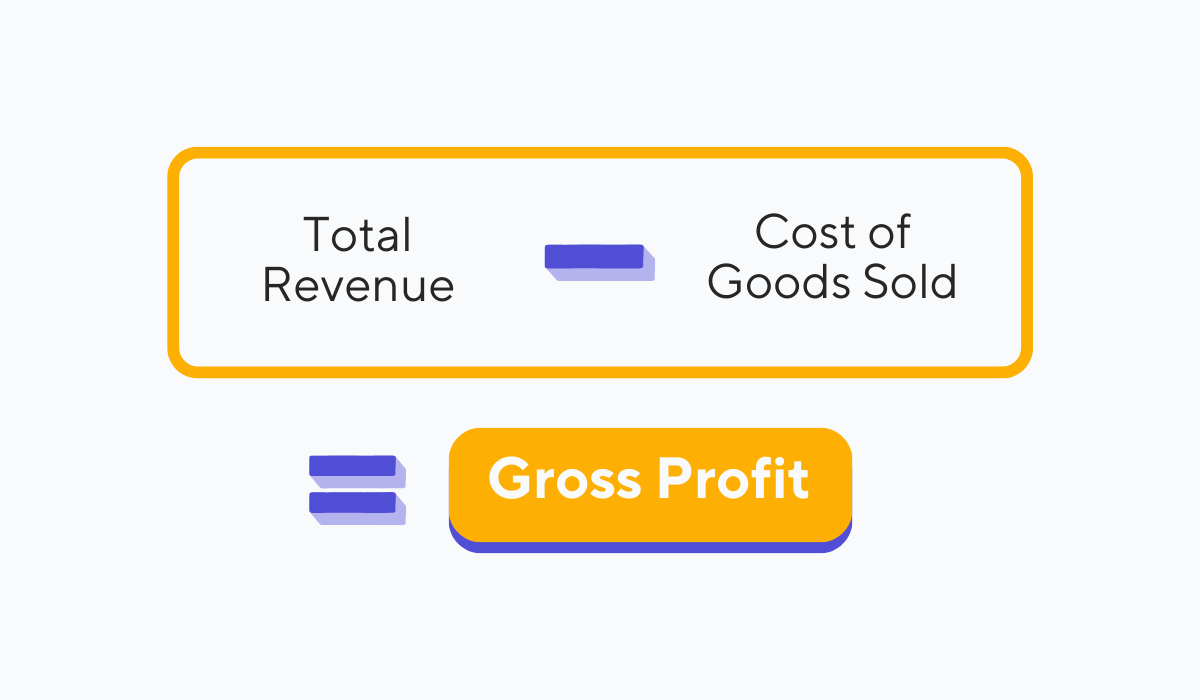
Source: Tablein
A high gross profit suggests effective cost management and a potentially profitable operation, while a low one could signal inefficiencies that need to be addressed, for instance, by reducing certain costs or increasing some of your prices.
As with other KPIs that track your profits, gross profit adds another dimension to the mix that should guide your decision-making.
Net Profit Margin
Gross profit is also useful for calculating another key performance indicator, the net profit margin.
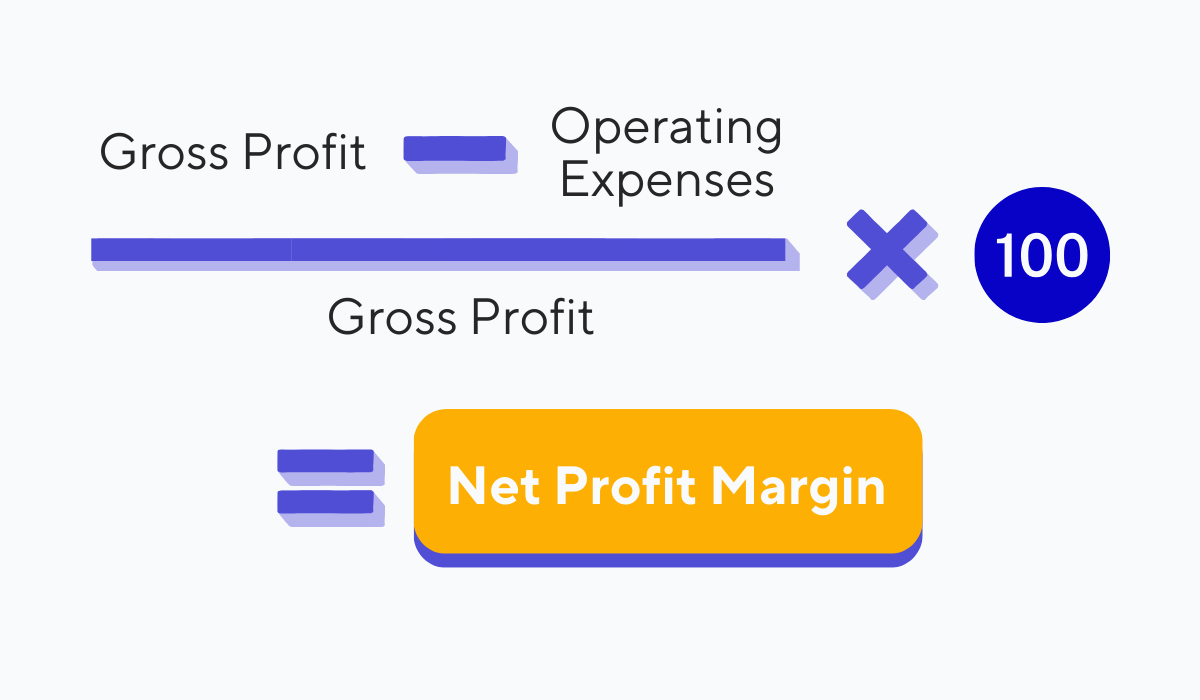
The net profit margin is the percentage of revenue that remains after all expenses, including CoGS, labor, and overhead, have been deducted.
It gives you a more comprehensive view of your restaurant's financial performance and operational efficiency than gross profit alone.
Take a look at the image below to see how you can calculate it.
Source: Tablein
The percentage you end up with with this calculation shows the overall profitability of your restaurant, which is the ultimate end goal for any business.
You get a concrete number that you can then use to compare yourself with your competitors and the averages within the industry.
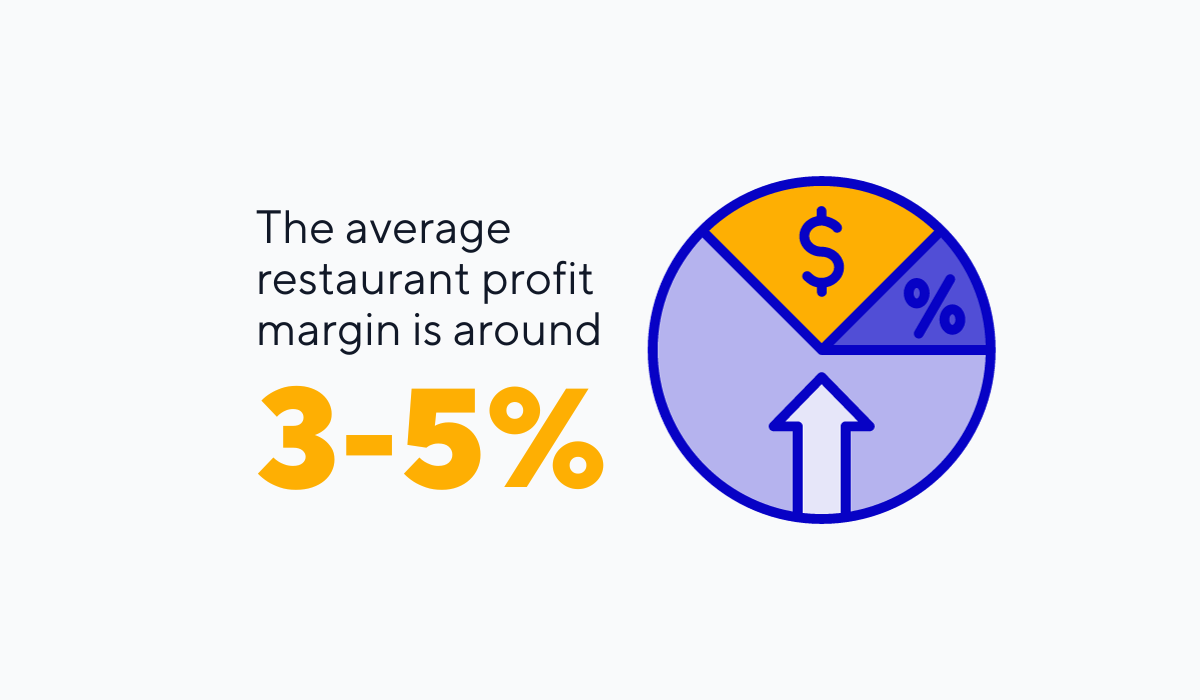
Illustration: Tablein / Data: Toast
Restaurant net profit margins are usually quite low, as shown by the data depicted above.
If your margin is lower than industry standards, it's time for changes. If you're exceeding industry averages, however, continue to maintain those best practices that are working for you.
Table Turnover Rate
A KPI that is vital for measuring your operational efficiency is your table turnover rate.
This rate indicates how quickly your staff can serve and clear tables in a given amount of time. It takes into account your restaurant’s capacity and the number of tables you have available at your establishment, along with the number of parties you manage to serve.
The formula for the table turnover rate is shown below.
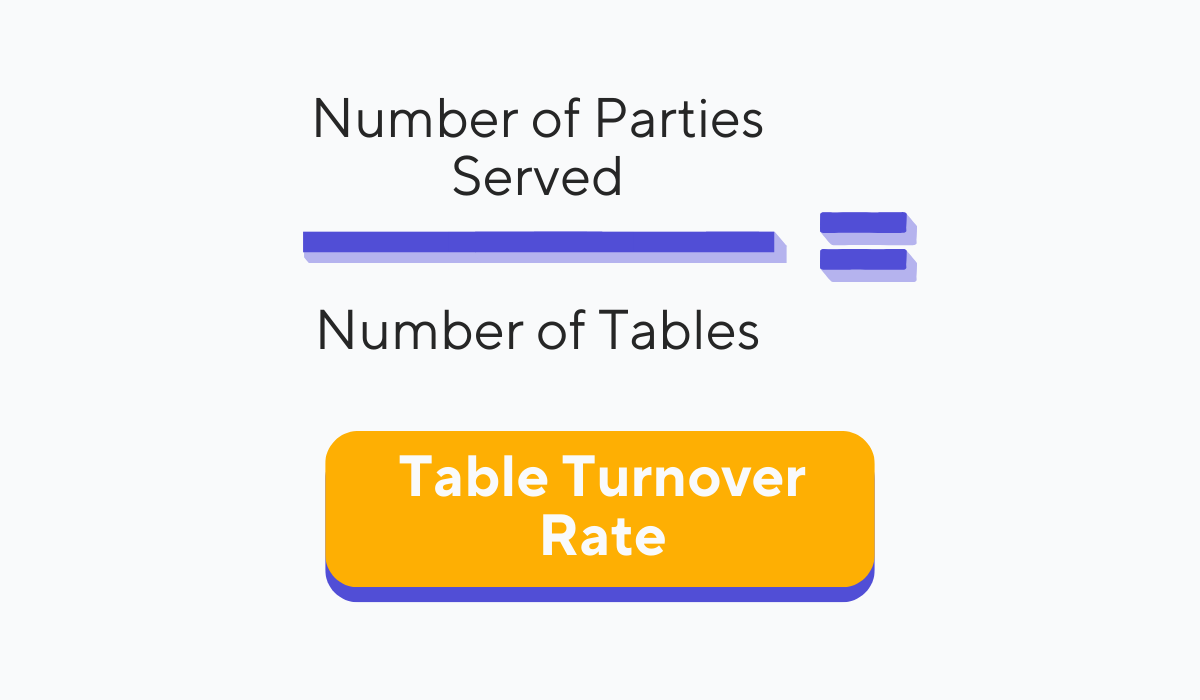
Source: Tablein
Understanding this KPI is vital for optimizing revenue and enhancing customer experience.
A high table turnover rate may indicate efficiency but could also suggest that customers are being rushed.
Conversely, a low rate may show that tables are unoccupied for too long, causing a loss in potential revenue.
The key is to find a balanced rate that aligns with your service quality and business goals.
Average Check Size
Turning to sales KPIs, let’s see your average check amounts to.
Calculating this indicator helps gauge the spending behavior of your customers and is calculated by taking your total sales and dividing it by the number of transactions in a given time period.
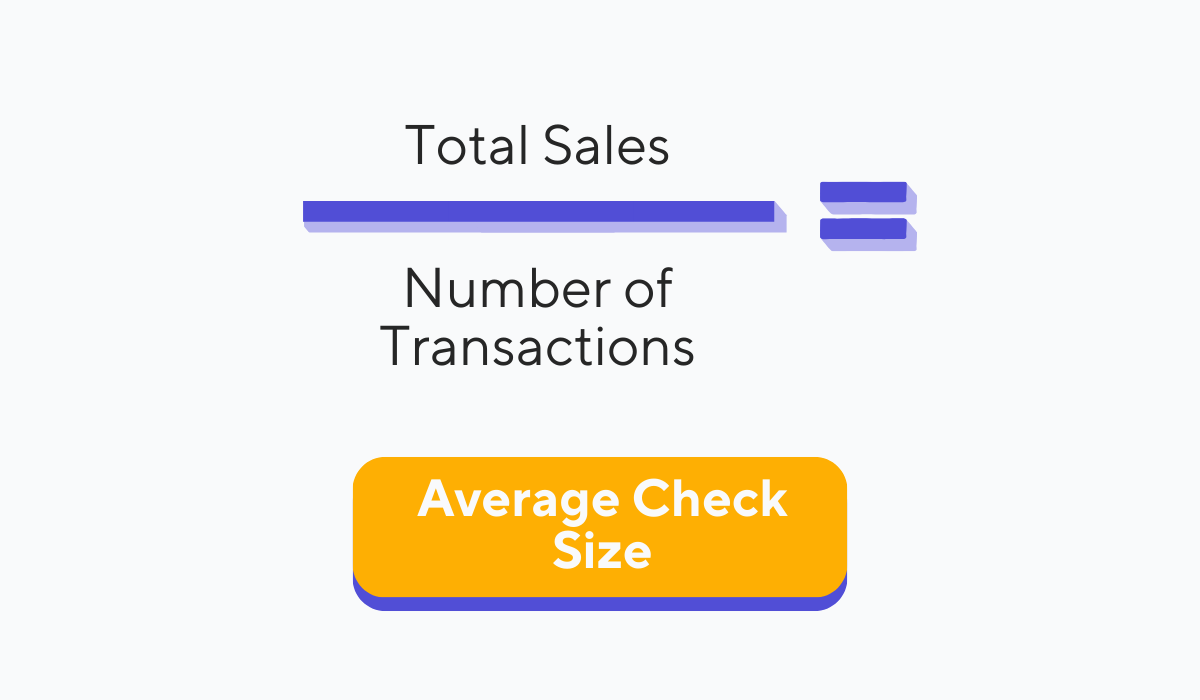
Source: Tablein
Understanding your average check size can help you determine whether you need more effective pricing and promotional strategies or even identify peak dining times.
A high average check size indicates that customers are willing to spend more, possibly due to the exceptional quality of your food and service.
Conversely, a low average check size might suggest the need for upselling techniques or better menu engineering to encourage higher spending.
All in all, this KPI can serve as a useful tool for making adjustments to your menu, pricing, and upselling strategies to maximize revenue.
Average Cover
You've looked at your average check size, but now let’s take a look at the individual diner.
That’s where the average cover KPI comes into play, which gives you an idea of how much each of your patrons is spending. Take a look at what the formula looks like below.
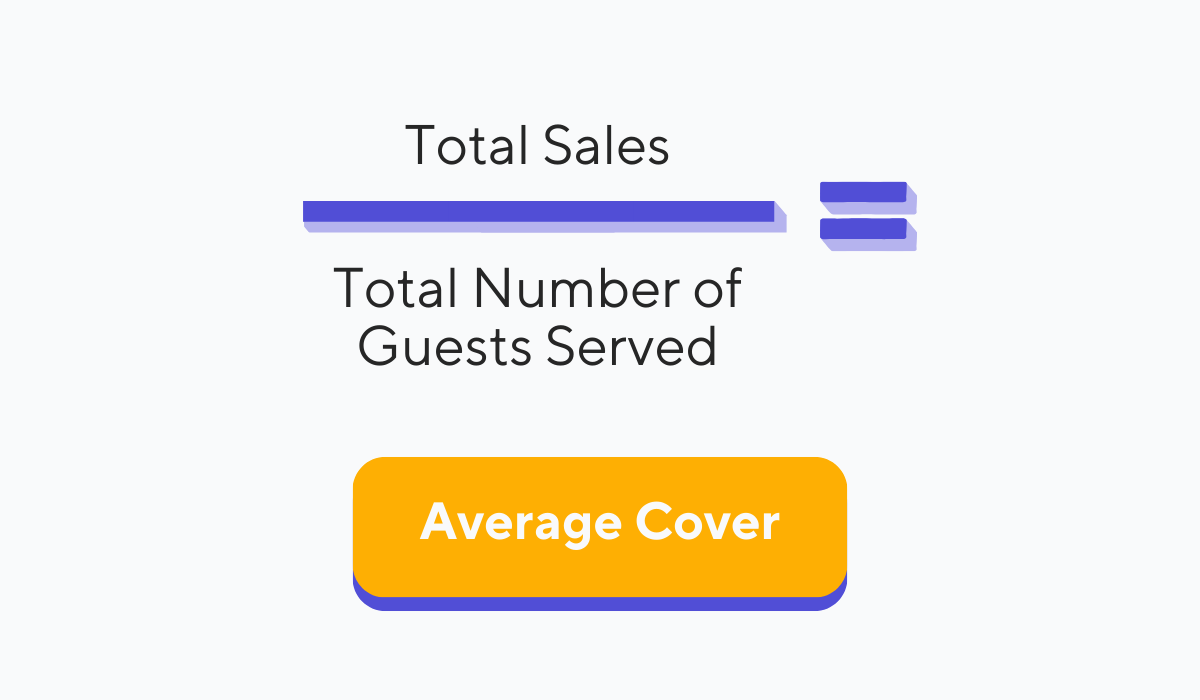
Source: Tablein
You can calculate your average cover for a single night or a longer period, like a week or a month. For example, if you made $4,000 in revenue in a single week and served 200 guests, that would mean that your average guest spent $20.
Understanding your average cover allows you to take a more nuanced approach to your revenue strategies, helping you tweak everything from menu offerings to pricing with greater accuracy.
Total Sales by Server
Finally, we have a KPI that takes a look into the performance of your servers.
Tracking the total sales of each of your serving staff members is an excellent way to evaluate your team’s performance and is as straightforward as it sounds. Simply calculate the sum of all the bills handled by each server during a specific timeframe.
Afterward, you can compare each of your waitstaff and pinpoint any issues in their performance. If you do, you can utilize some of the following tips that can help you increase this KPI.
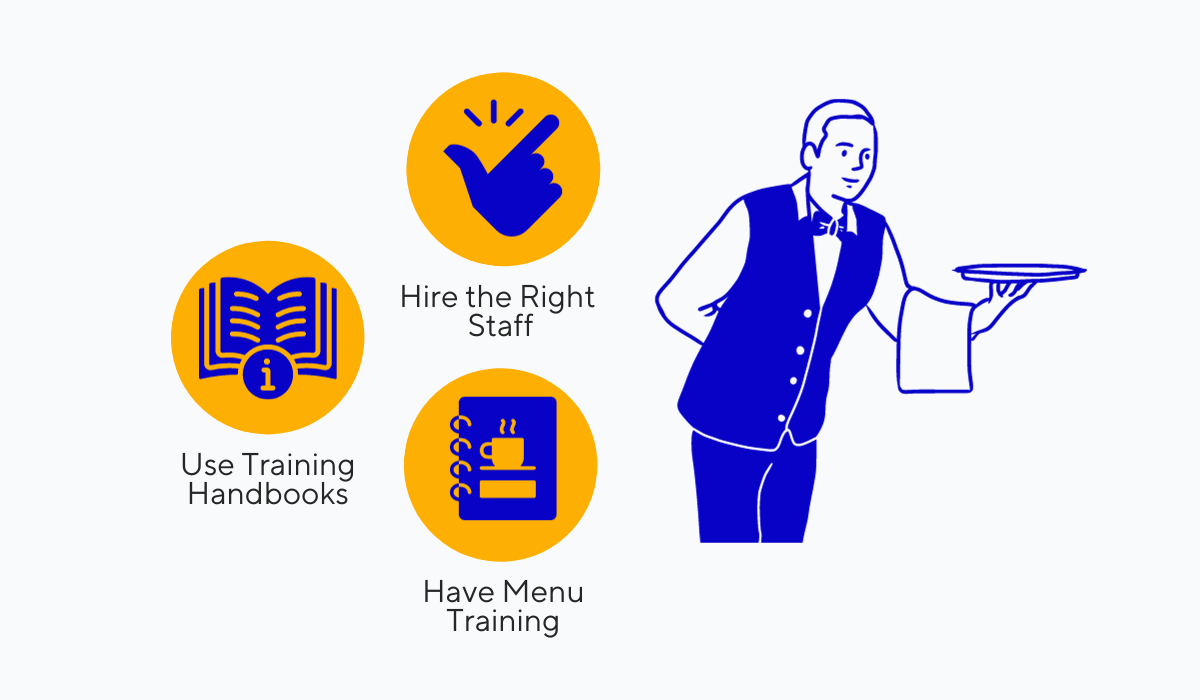
Source: Tablein
If you notice some servers are underperforming, start by evaluating your hiring process. Did you hire the right person for the job? Perhaps you did, but more training is needed—in this scenario, a detailed operations manual can provide the necessary guidelines for efficient work.
Finally, menu knowledge is also crucial, as a well-informed server is likely to sell more by upselling and cross-selling.
To sum up, keeping an eye on the total sales of your employees allows you to measure their performance and help optimize it if any issues arise.
Conclusion
And there you have it, twelve crucial KPIs that we believe every restaurateur should measure.
We’ve covered everything from sales performance to overhead costs, table turnover rates, the average bill, and even how efficiently your waitstaff is operating.
Our hope is that you’ll walk away with a comprehensive toolkit to better understand and improve your restaurant's performance. While these aren’t the only KPIs out there, regularly tracking the ones we’ve listed here is essential for any restaurant owner aiming for success.
Armed with this information, you can optimize your operations for greater profits and a healthier bottom line, thus ensuring your restaurant survives the ups and downs of the food service industry.
So, go ahead, turn these insights into action, and watch your restaurant thrive like never before!
Share this

How to Improve Your Restaurant Reservation Management

Top Restaurant Automation Tools for Streamlining Operations