Are you satisfied with your restaurant’s performance?
Tables are full on busy Friday and Saturday nights, giving the appearance of success. However, if profits remain flat or decline, maybe your pricing is the issue.
But it could be something else.
So, how can you know precisely what the source of your problems is?
The solution is to consistently track KPIs (key performance indicators), which can pinpoint specific problem areas and necessary improvements.
And even if your restaurant is running smoothly at the moment, regularly monitoring KPIs is vital to stay ahead of the competitive restaurant industry.
However, the world of KPIs can be complex, with numerous metrics to consider.
Still, there are five types of restaurant KPIs that every restaurateur should know about—profitability, reservation, staff, customer experience, and marketing KPIs.
Knowing to which category a specific KPI belongs will help you better understand your restaurant’s health and room for improvement.
So, join us as we explore each of them.
Table of contents
- Restaurant Profitability KPIs
- Restaurant Reservation KPIs
- Restaurant Employee KPIs
- Restaurant Customer Experience KPIs
- Restaurant Marketing KPIs
- Conclusion
Restaurant Profitability KPIs
To find the reasons behind profit declines or stagnations or simply to understand your overall financial performance, you should track your profitability key performance indicators.
Source: Tablein
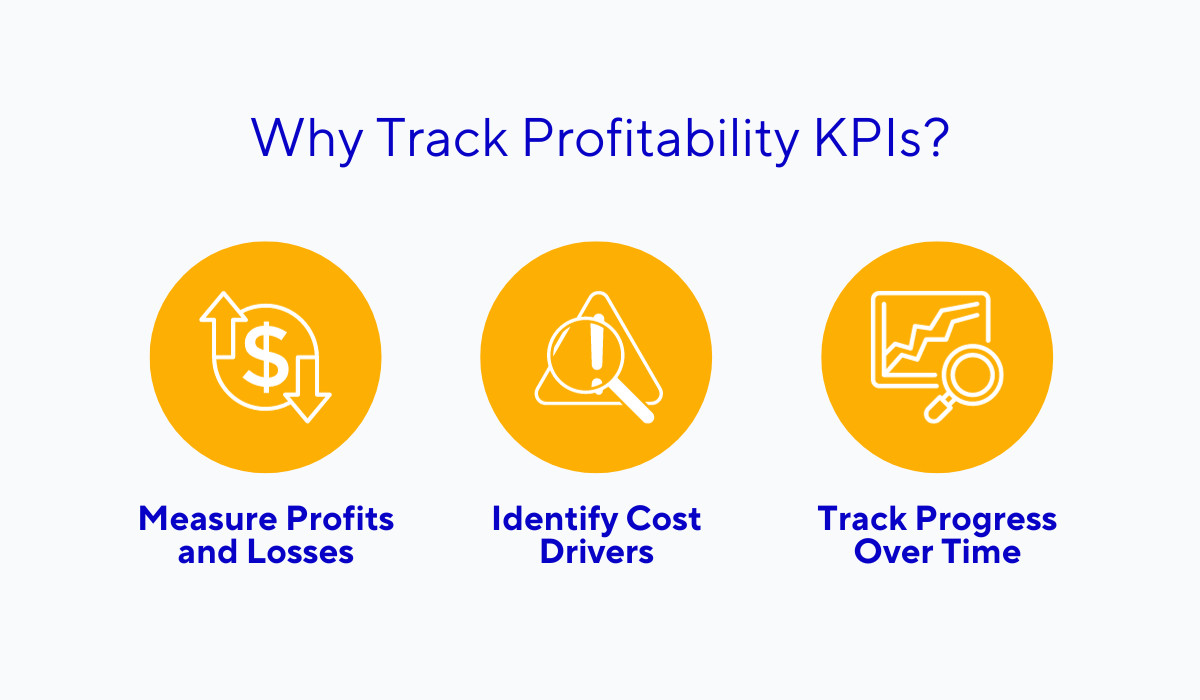
First, keeping an eye on profitability KPIs allows you to measure your restaurant’s financial health.
It helps you understand whether your business is making a profit or incurring losses, and most importantly, how and where.
Since these KPIs can pinpoint specific cost drivers, you will be able to identify areas where your costs spiral out of control.
And on top of that, you can use these KPIs to benchmark your restaurant’s performance over time.
For instance, you can compare your current data with historical figures to assess whether your business is improving or facing challenges.
In essence, KPIs can give you important insights into your restaurant operations and show you where to make changes.
Let’s now break down which KPIs fall into this category and briefly explain what they mean and how to calculate them.
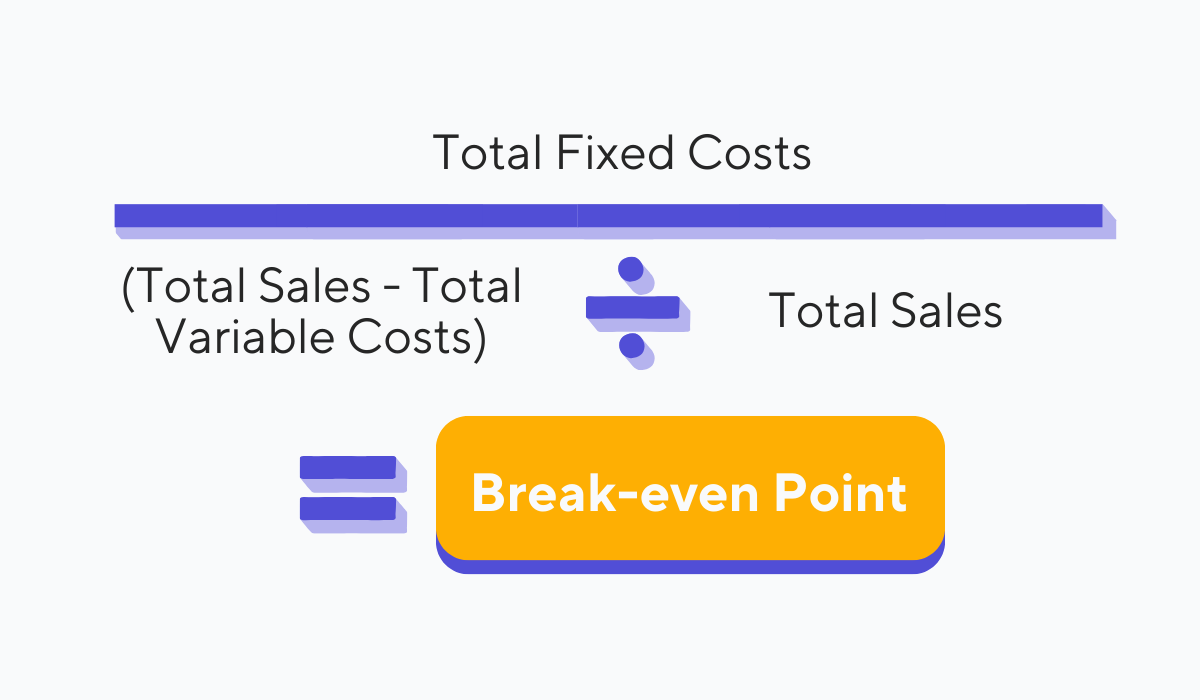
Break-Even Point
The break-even point is the moment when your total sales cover all your costs—fixed (like rent and salaries) and variable (like food and supplies). Beyond this point, every sale brings you profit.
The formula below shows how you can calculate it:
Source: Tablein
If your break-even point is low, you will cover your costs quickly. This is positive as you start generating profit sooner.
On the other hand, a high break-even point means you need more sales to cover expenses, which may imply that your cost structure or pricing needs optimization.
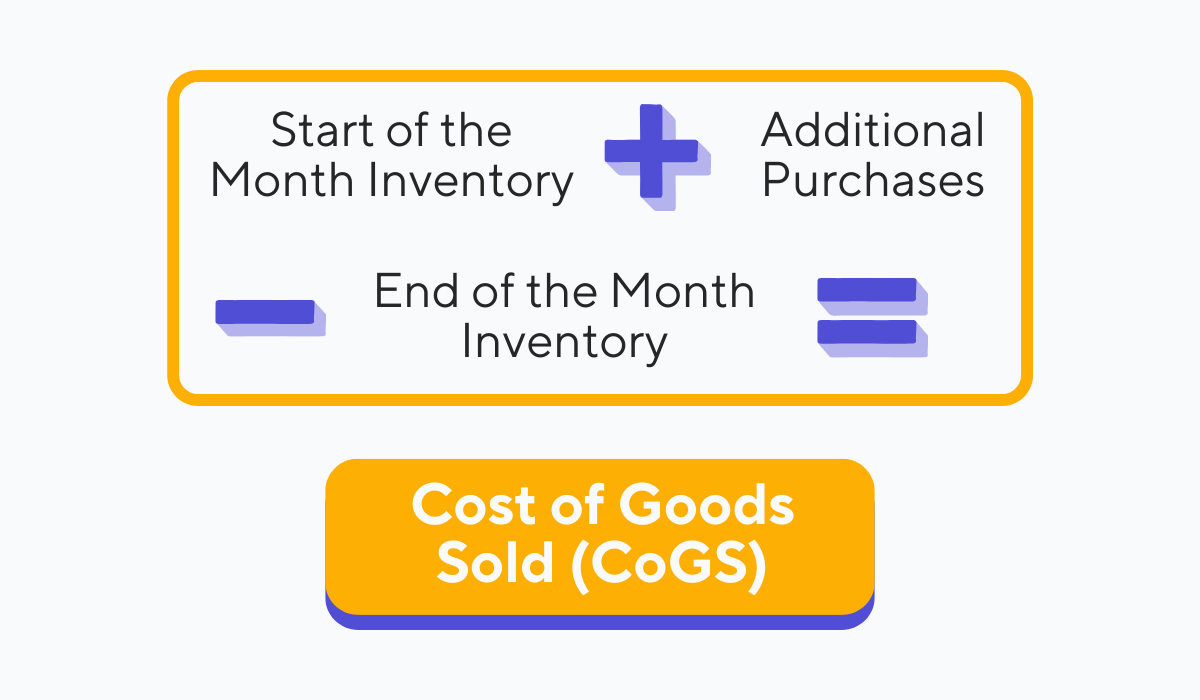
Cost of Goods Sold (COGS)
This key performance indicator calculates the direct expenses of producing the food and beverages you serve.
Suppose your restaurant specializes in pizzas.
Let’s say that, at the beginning of the month, you had $1,000 worth of pizza ingredients in your inventory. During the month, you purchased additional ingredients for $4,000.
Finally, at the end of the month, your remaining inventory of pizza ingredients was $800.
When you put these numbers in the formula below, your COGS for the month will be $4,200.
This represents the direct cost of producing the pizzas you served during that period.
Source: Tablein
A lower COGS suggests more efficient cost management, contributing to a higher profit margin.
In comparison, a higher COGS could indicate that you don’t manage your inventory that well or that your menu prices are too low.
However, this KPI has to be evaluated in the context of your overall financial performance to understand how high or low you can go.
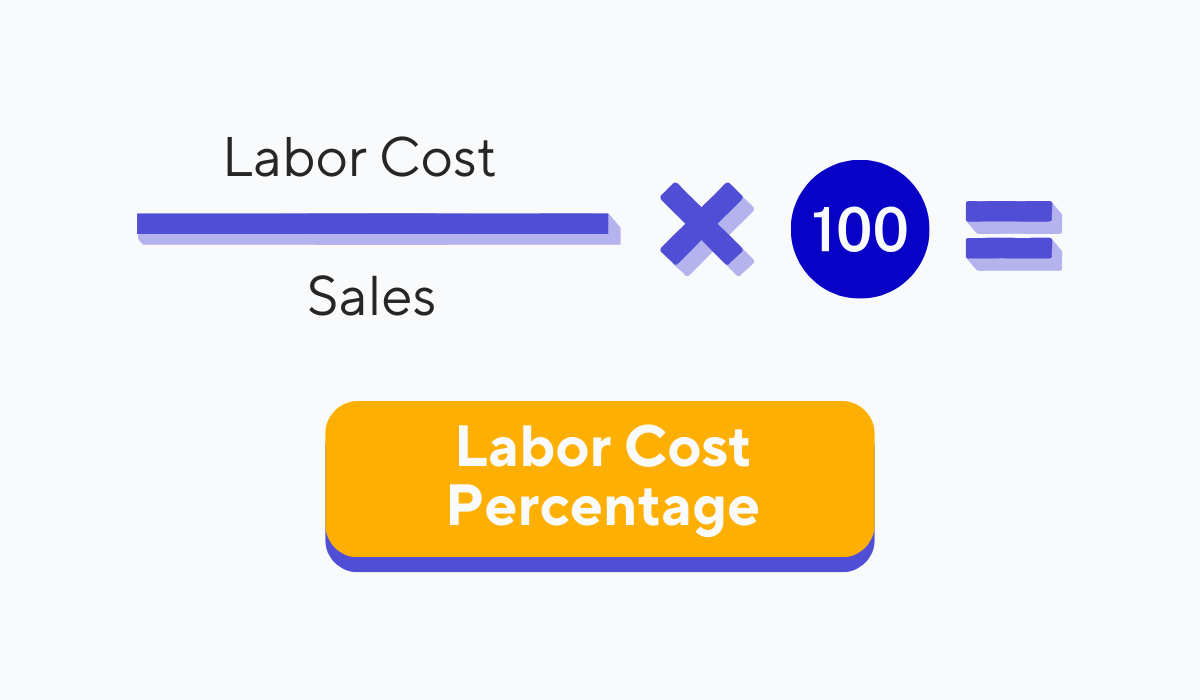
Labor Cost Percentage
This KPI indicates what portion of your restaurant’s revenue is spent on labor—all expenses related to your staff, including wages and benefits.
The average labor cost percentage in the restaurant industry is between 25 and 35%.
By calculating your labor cost percentage using the formula below, you can measure where you stand concerning average.
Source: Tablein
This KPI helps you assess how efficiently you utilize labor in your restaurant.
For example, if the percentage is higher than the average, it could mean you are overstaffed and it’s time to optimize your staffing.
Prime Cost
Prime cost encompasses COGS and total labor costs. It reflects what you spend on ingredients and staff salaries—two of the most costly elements in running a restaurant.
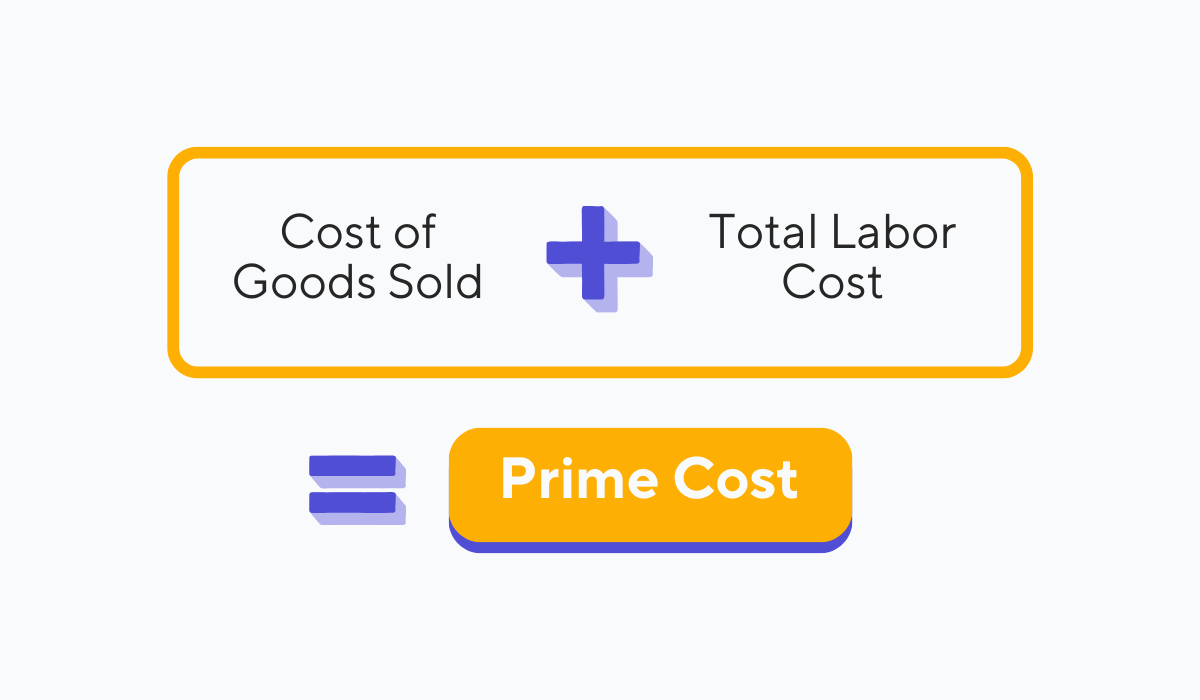
Source: Tablein
A lower prime cost signifies efficient control over ingredient and labor expenses, resulting in better profit margins.
Conversely, a higher prime cost may indicate issues in managing food and labor costs, affecting profitability.
In both cases, this KPI serves you as a straightforward guide to where you should optimize your biggest expenses.
Gross Profit
Gross profit shows the revenue left after deducting direct costs of making and serving food and drinks.
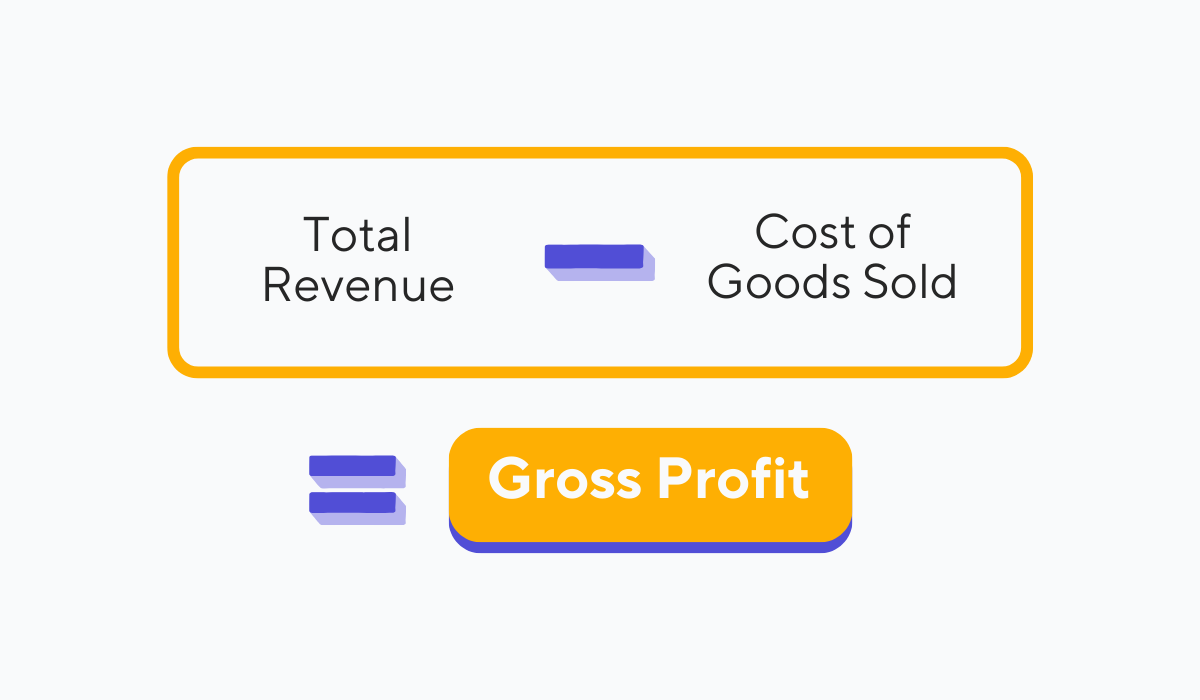
Source: Tablein
A lower gross profit suggests that a significant portion of your revenue goes toward covering expenses, affecting your overall profitability.
On the other hand, a higher gross profit indicates effective cost management and pricing, contributing to healthier profit margins.
Net Profit Margin
Net profit margin reveals the percentage of your total revenue that remains as profit after all expenses are deducted. This is the KPI that shows how profitable your business is.
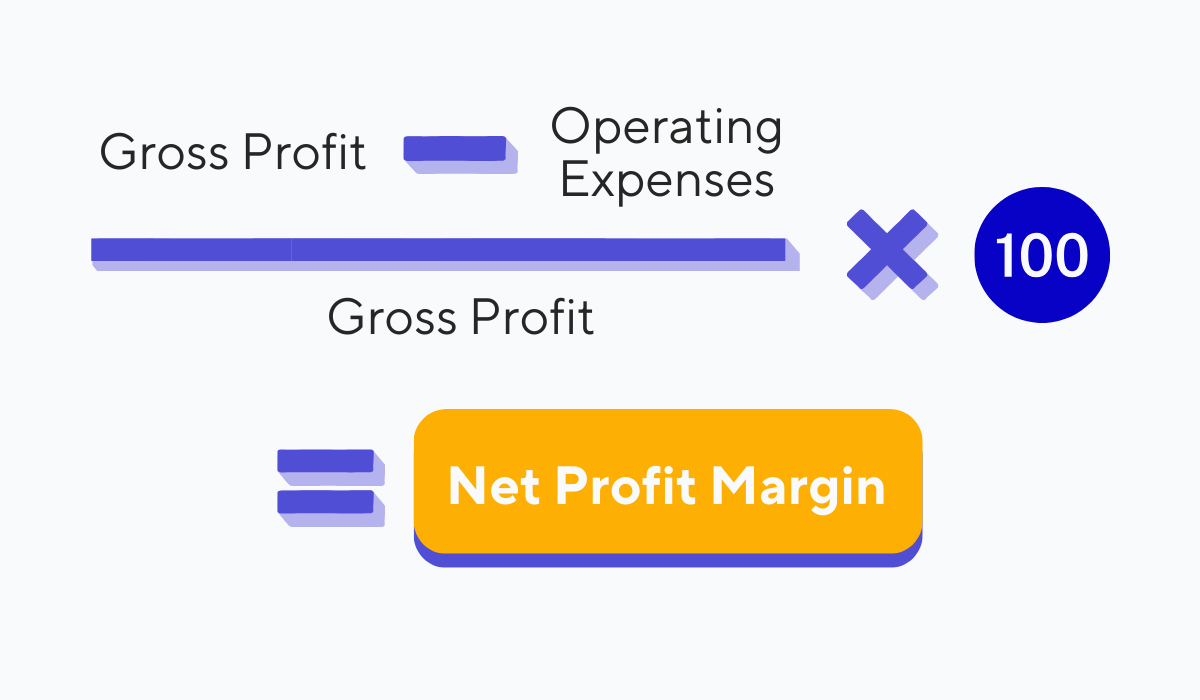
Source: Tablein
A lower net profit margin means a smaller percentage of your revenue translates into profit. It might signal inefficiencies or excessive expenses.
However, the net profit margin in this industry is pretty low—around 3 to 5%, so don’t be discouraged if yours is somewhere here too.
But if it’s lower than this, it’s time to make significant changes.
And here you have it.
These were six crucial profitability KPIs that you should track in your restaurant.
Understanding them will help you make informed decisions about your inventory, menu pricing, and overall cost management.
Let’s now shift our focus to the second KPI category—restaurant reservations.
Restaurant Reservation KPIs
When it comes to efficient restaurant management, you should definitely pay attention to reservation KPIs.
Let’s explore why they matter.
First, reservation KPIs help ensure your restaurant makes the most of its available seating.
By tracking reservation trends, you can assign tables wisely, reduce waiting times, and enhance the overall dining experience for customers.
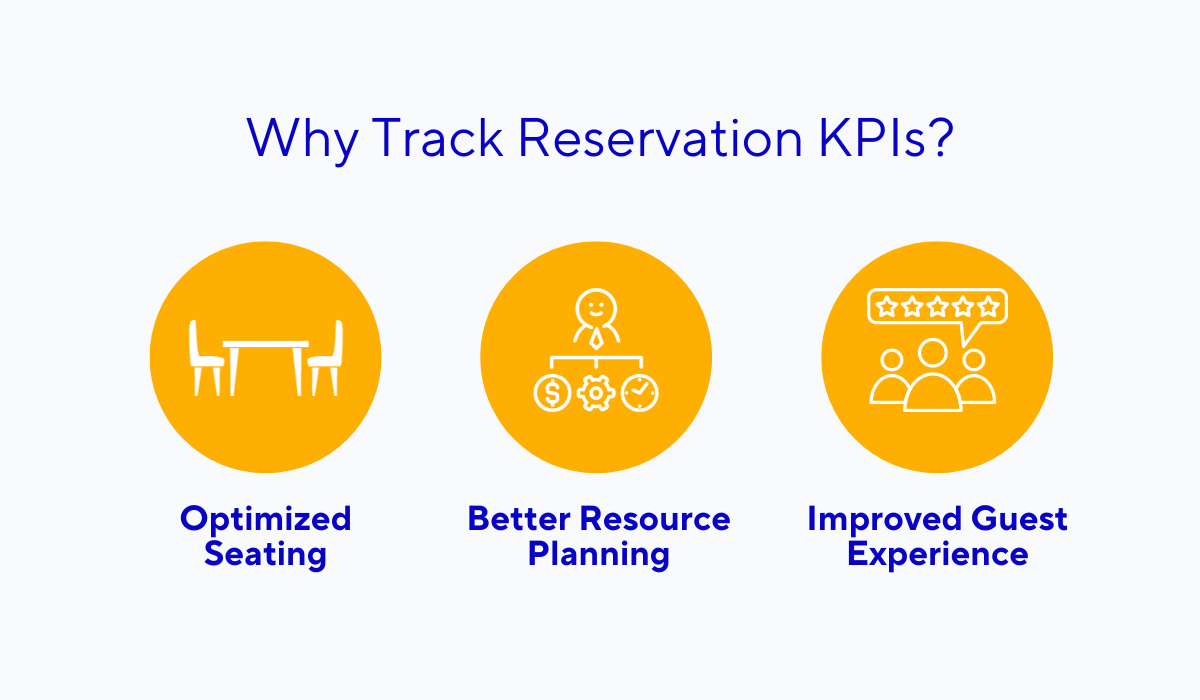
Source: Tablein
Monitoring reservations also helps you better plan and allocate your resources, including staff schedules and food preparation. This minimizes waste and streamlines operations.
Additionally, reservation data can offer insights into guest preferences and behavior.
By analyzing reservation patterns and special requests, you can personalize the dining experience, leading to happier customers and repeat business.
Finally, keeping an eye on reservation-related metrics like cancellations, late cancellations, and no-shows helps you minimize revenue loss and make informed decisions.
In the following sections, we’ll briefly describe the most important reservation KPIs and why you should track them.
Walk-Ins vs. Reservations
If your restaurant takes reservations, knowing how many of your guests book their tables and how many simply walk in is crucial.
Monitoring this KPI helps you strike the right balance between reserved and walk-in guests, allowing you to optimize seating and adapt reservation policies.
There is no formula to calculate this—you have to keep an eye on your guest flow and track whether they reserve tables or spontaneously walk in.
Cancellation Rate
The cancellation rate shows how many customers cancel reservations before the reservation date.
If they cancel in time, you have a chance to fill those tables with other customers.
You can calculate it with the following formula:

Source: Tablein
And remember—cancellations are normal because plans change.
However, a high cancellation rate may indicate issues with booking or communication that affect your efficiency.
Late Cancellation Rate
Late cancellations, reservations canceled close to the reservation time, pose a bigger challenge.
The formula to calculate them is the same as for cancellations, but the consequences are not.
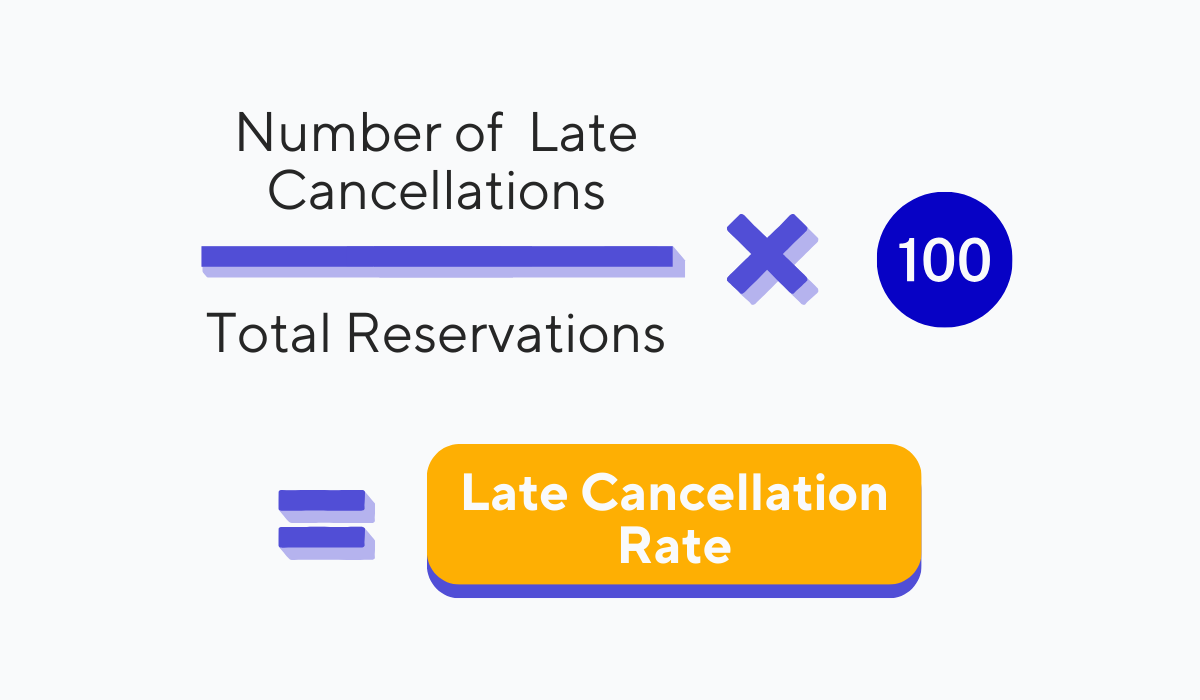
Source: Tablein
When cancellations are made too late, you miss the chance to fill the tables with new diners and lose revenue for those tables.
However, if you monitor this KPI and the rate is high, you can take proactive measures like late cancellation fees.
When your patrons know there are financial consequences for not canceling in time, they will more likely re-think their decisions.
No-Show Rate
No-shows happen when the guests who have made a reservation fail to show up without notifying you.
Statistics show that one in five diners in a big city turns out to be a no-show, so you can probably understand the impact this has on the restaurant industry.
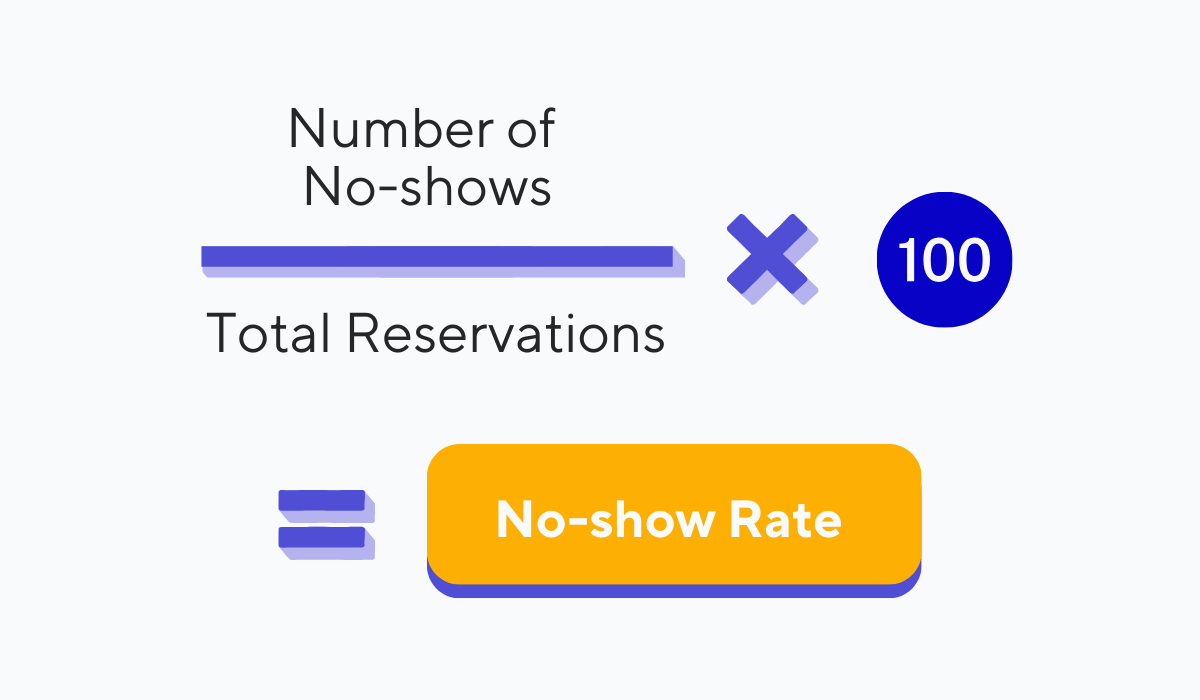
Source: Tablein
But if you calculate your no-show rate (using the formula above), you will be more sure whether you should implement strategies like deposits and no-show fees to minimize this issue.
Understanding your customers and their preferences, whether they prefer to walk in or make a reservation, and tracking cancellations and no-shows are vital for your restaurant’s success.
But, tracking these numbers manually can be time-consuming and prone to errors.
However, reservation tools like our restaurant reservation software, Tablein, make this process easy.
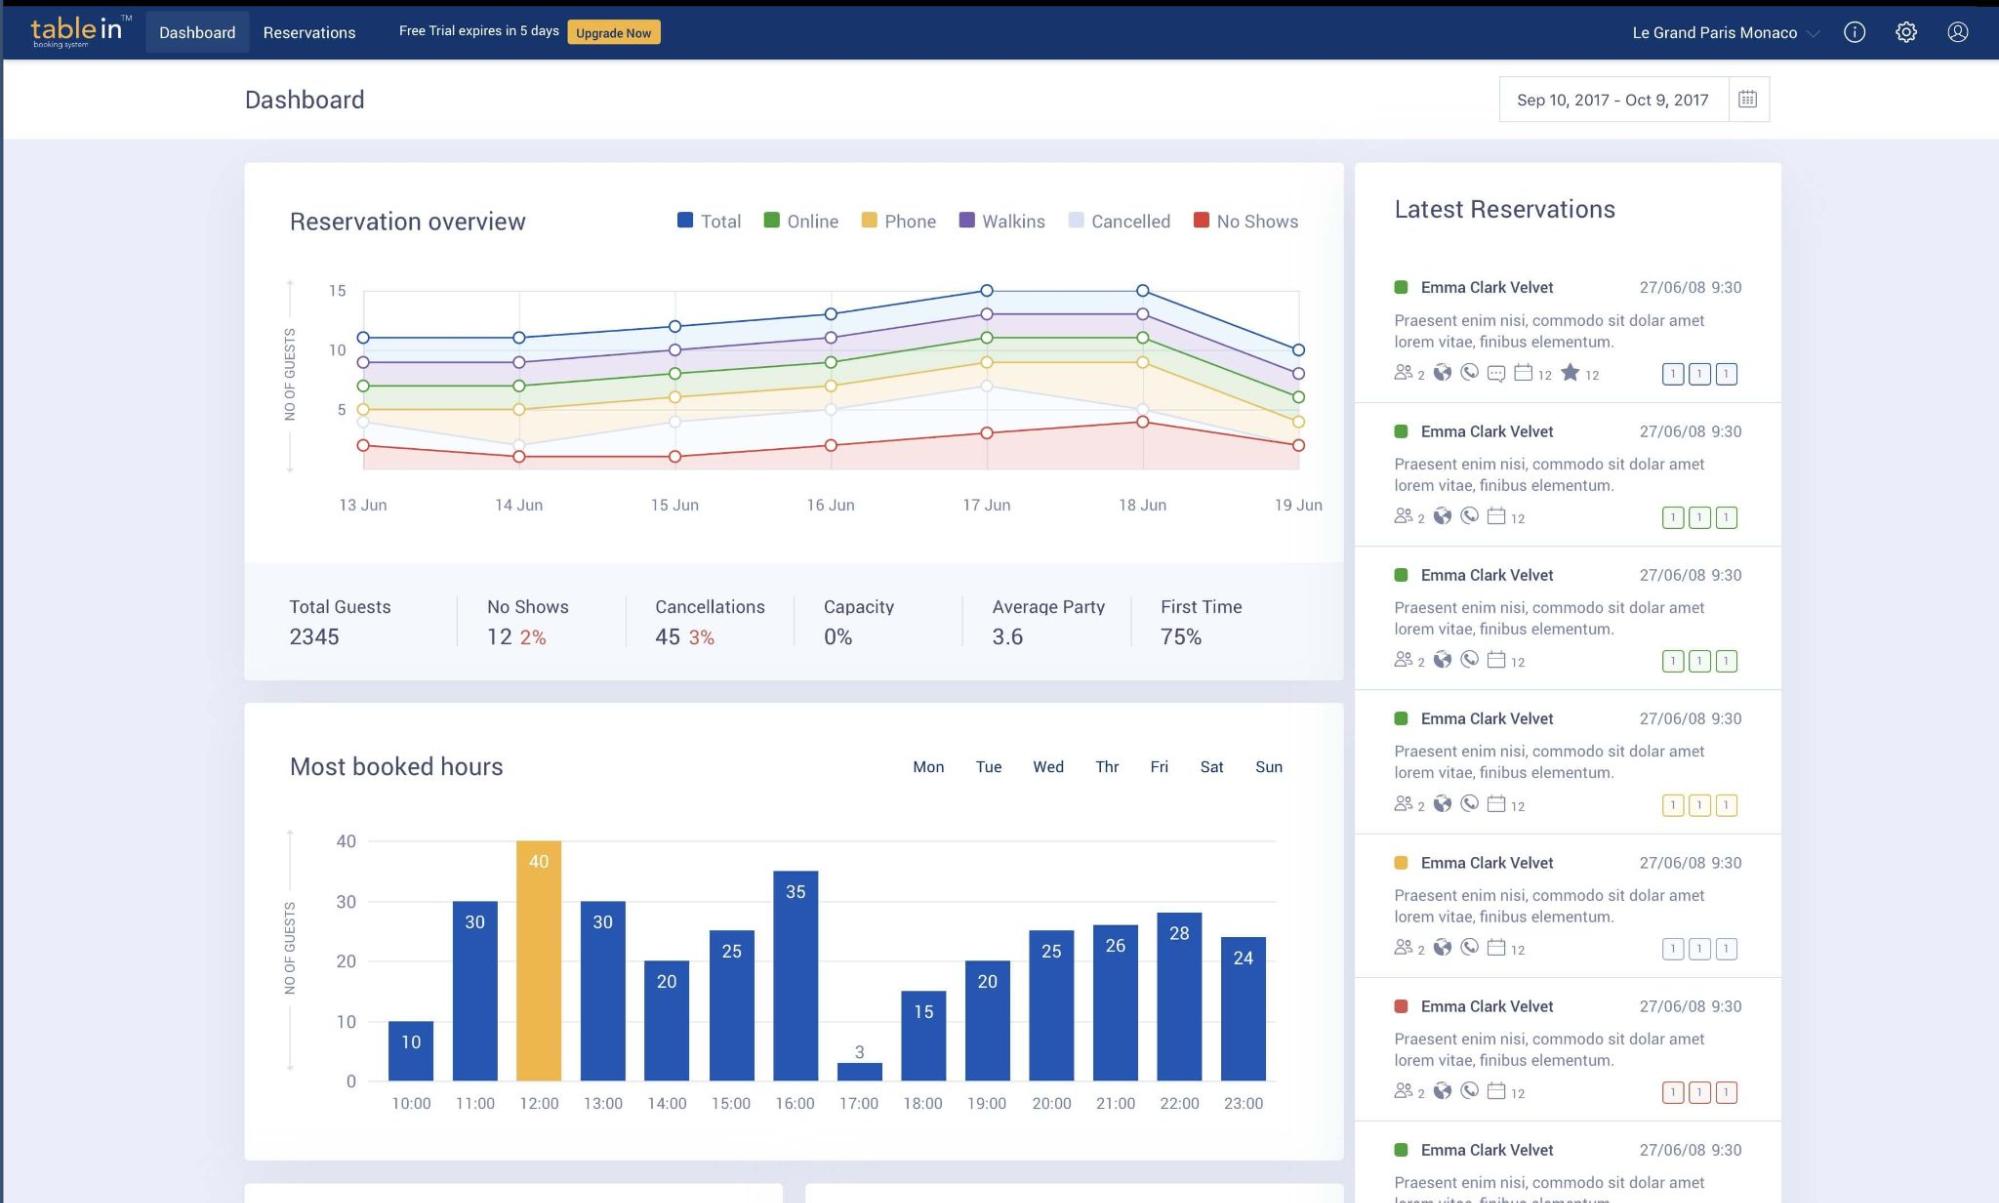
Source: Tablein
Tablein’s reporting dashboard provides a clear view of reservation and guest data, including statistics on total guests, no-shows, cancellations, and late cancellations.
And you can also easily add walk-ins to it.
On top of that, Tablein can show you the most booked hours in your restaurant, where your customers are from, which ones are most likely to return, and much more.
So, with one tool—or better yet, one dashboard—you get a comprehensive picture of your restaurant’s guest flow and data for tracking these key performance indicators.
Restaurant Employee KPIs
In the restaurant industry, understanding and managing your employees is crucial.
Employee key performance indicators play a significant role in this aspect, measuring both the frequency of staff turnover and their efficiency in performing their roles.
These KPIs are vital for maintaining a successful restaurant, so let’s address the most important ones.
Employee Turnover Rate
Retaining employees is a common challenge in the restaurant business, with the turnover rate being as high as 79.7% over the past decade.
You, too, can calculate this KPI with the formula below, and you will get a percentage of how often employees leave your restaurant.
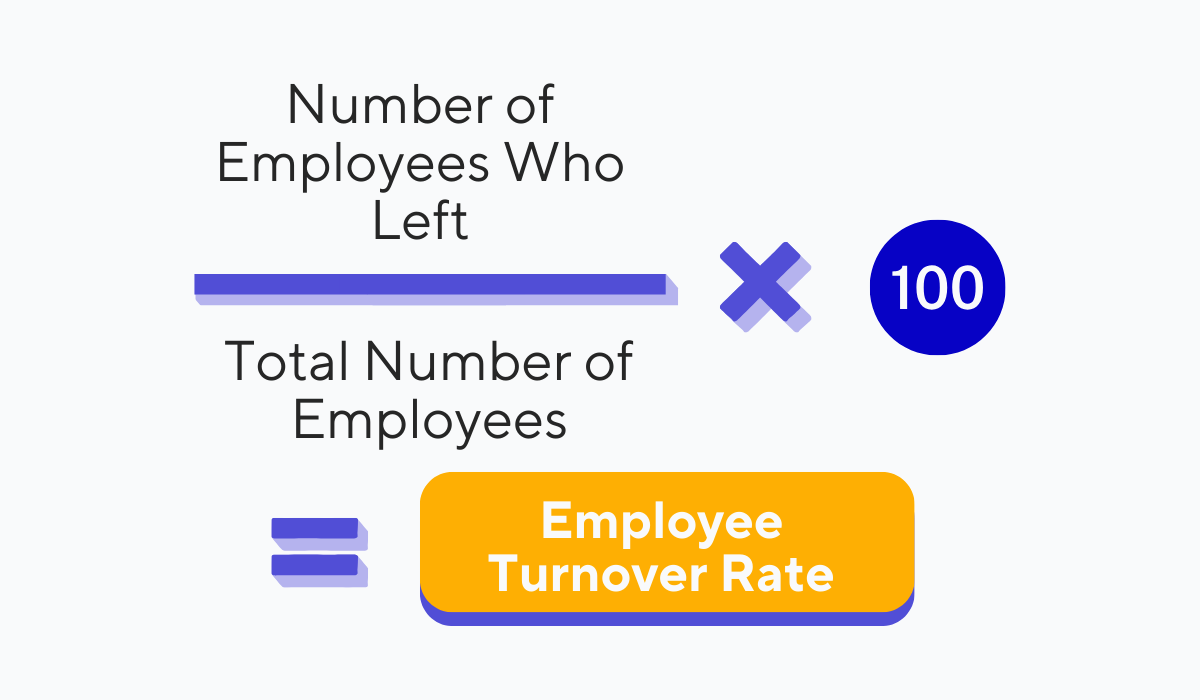
Source: Tablein
For example, if 10 out of your 50 employees leave in a year, your turnover rate is 20%.
A high turnover rate can result in increased training costs and disruptions in service quality.
But, if you monitor this KPI closely, you can implement strategies to retain valuable staff and lead a stable team that will contribute to consistent service quality and guest satisfaction.
Table Turnover Rate
Efficiency in turning over tables is another critical aspect of every restaurant.
This KPI measures the number of parties served at a table during a specific time, indicating how quickly your restaurant can accommodate new guests and maximize revenue.
This metric also includes how promptly servers approach diners, serve them, and later clean up tables.
The formula is as follows:
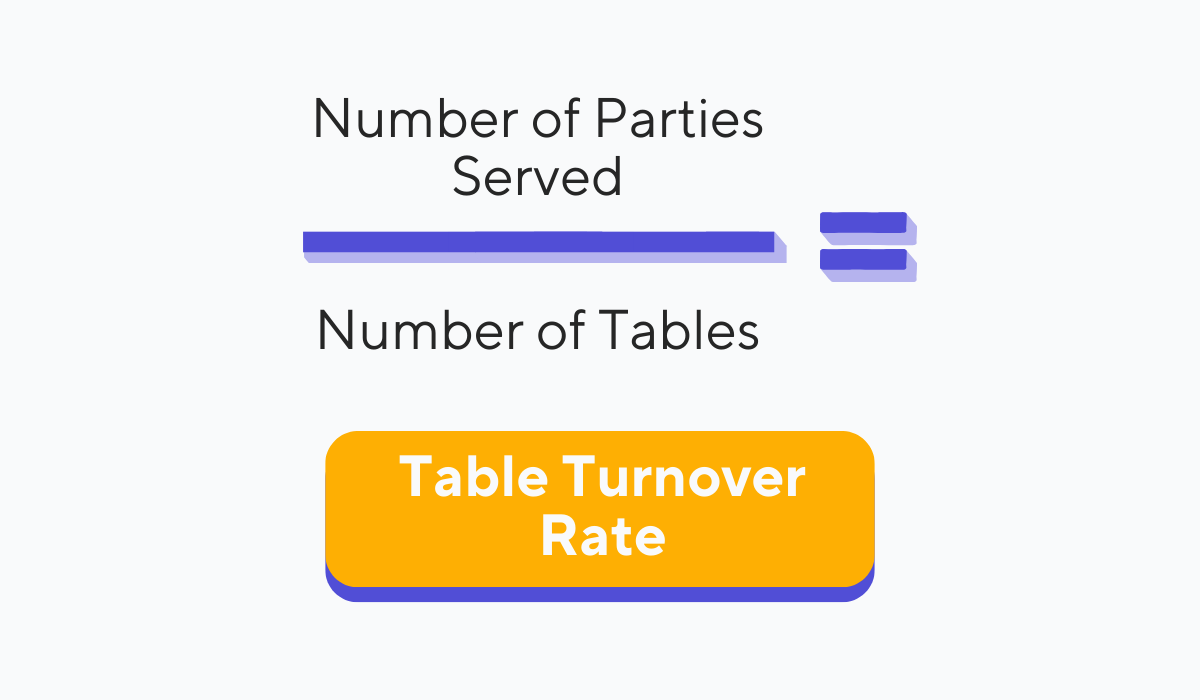
Source: Tablein
A higher table turnover rate means you can accommodate more guests, potentially increasing profits while ensuring your staff is fast and efficient.
However, you have to make sure that this high rate does not result from rushing your customers.
Total Sales by Server
Your servers’ sales performance directly reflects their efficiency and effectiveness.
Total sales by server KPI identifies top-performing servers in your restaurant and those who may need additional training.
Optimizing server performance not only enhances the guest experience but also boosts sales, ultimately benefiting your restaurant’s profitability.
In addition to these three KPIs, you can also track other metrics, such as the number of mistakes per server per guest or the number of guests served per hour.
This will give you a broader picture to understand what value each of your servers brings to the restaurant.
In the end, monitoring these employee KPIs can help you create a more efficient and successful restaurant where staff turnover is reduced, tables are turned efficiently, and sales are optimized.
Restaurant Customer Experience KPIs
The fourth type of KPIs you should know about is customer experience KPIs.
Calculating these metrics can help you understand how well you’re serving your customers and allows you to make informed improvements.
These KPIs also give you insight into your customers’ spending habits, which can be a breakthrough for better pricing strategy, menu optimization, and even upselling opportunities.
Let’s explore three such KPIs in more detail.
Spend Per Head
This KPI measures the average spending per guest, providing insights into guest spending habits. It is both profitability KPI and customer experience KPI.
Measuring it can help you set menu prices that align with customer expectations but still bring you profit.
You can calculate it with the following formula:
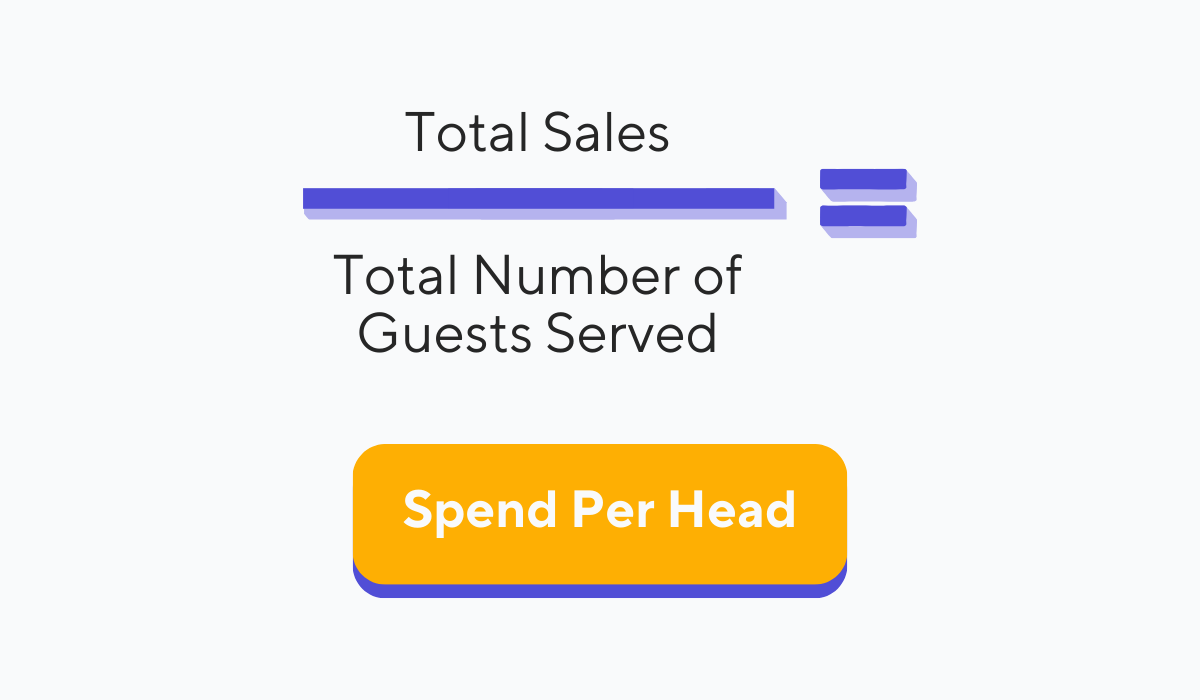
Source: Tablein
In addition to the previous benefit, calculating spend per head helps you estimate daily, weekly, and monthly revenue, allowing for better inventory management and staffing decisions.
Returning Customer Percentage
Returning customer percentage is the percentage of guests who have dined at your restaurant more than once.
This KPI indicates how loyal your customer base is and how good your customer retention is.
The formula to calculate the percentage goes like this:
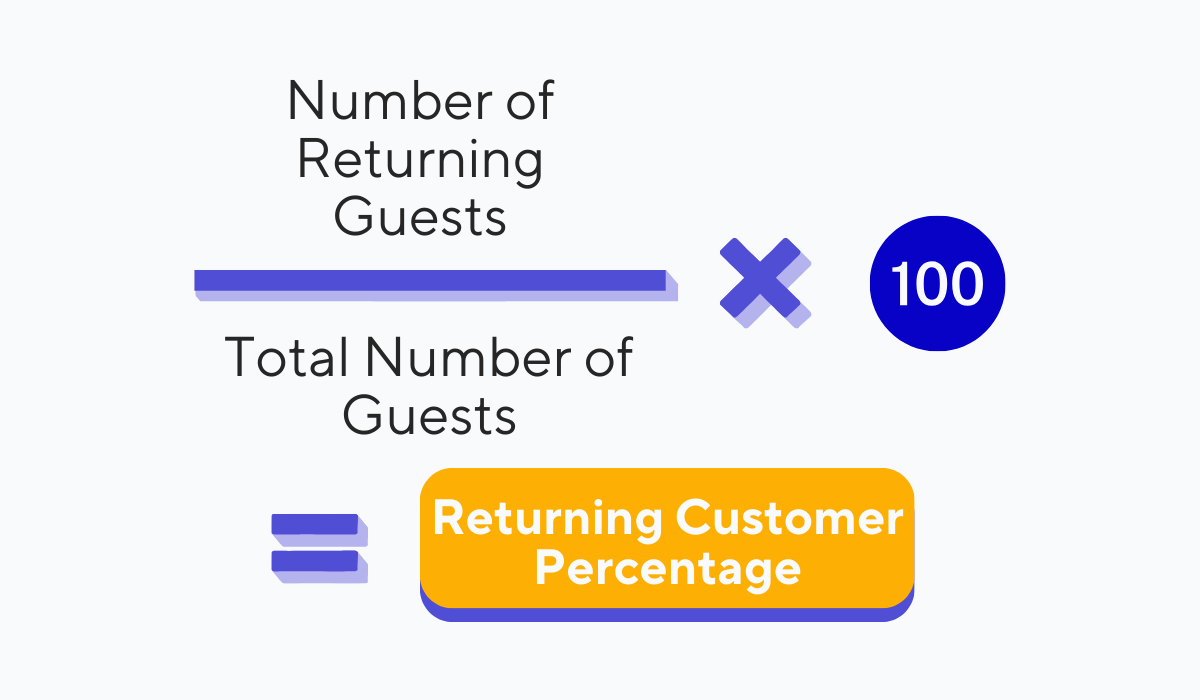
Source: Tablein
Statistics show that when you increase customer retention by just 5%, your profits can increase by 25% to even 95%.
So, you should always strive to have this KPI as high as possible.
Customer Satisfaction Score (CSAT)
We will finish customer experience KPIs with the customer satisfaction score—a fundamental KPI of this type.
Customer satisfaction score shows customer contentment with their experience, reflecting the quality of service, food, and ambiance.
You can measure it through your patrons’ feedback.
For example, after their visit, you can ask customers to give you feedback or comments on the food and service you provided by email, like in the example below.
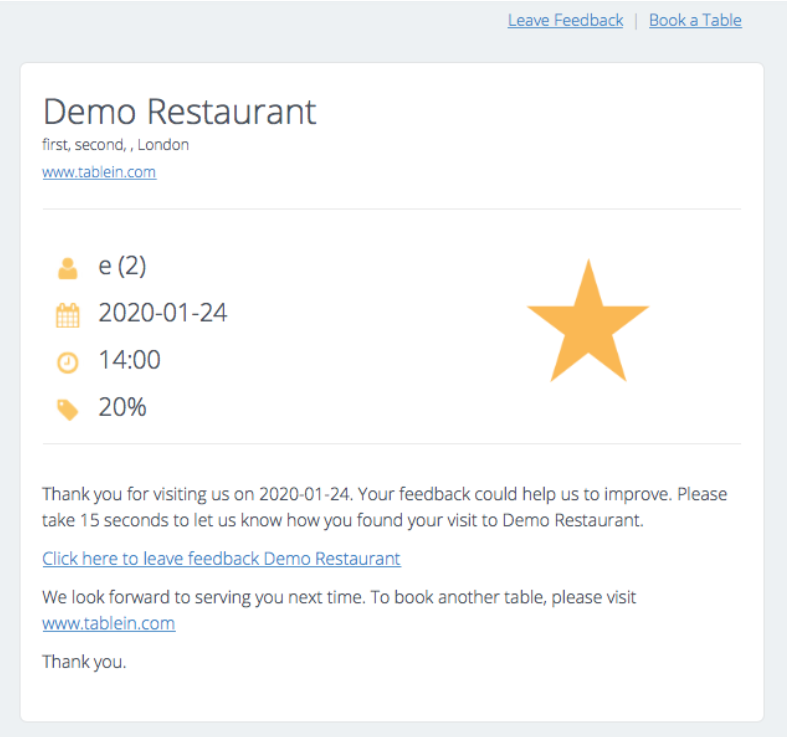
Source: Tablein
You can even create a questionnaire to rate their satisfaction from 1 (very dissatisfied) to 5 (very satisfied) or 1 (poor) to 10 (excellent).
Another thing you could do to understand your customers’ satisfaction is check online reviews on Google or TripAdvisor.
In essence, regularly collecting and analyzing CSAT data, as well as the retention score and spend per head, helps you understand how well your restaurant meets customer expectations.
Moreover, these KPIs allow you to identify areas for improvement, and with these insights, you can enhance the dining experience to drive customer loyalty and business success.
Restaurant Marketing KPIs
In today's digital age, your restaurant's online presence can make or break your success.
It's not just about having a website or social media profile. It's about using these tools to get more customers and improve your restaurant business.
And leveraging marketing key performance indicators can reveal whether you are on the right track to achieve this.
Let's explore some metrics that fall into the marketing type of KPIs.
Conversion Rate
If you are taking reservations through your website, measuring how many visitors open the reservation widget and make the reservation from start to finish would be wise.
Also, it is equally important to know the number who open it but leave soon after without taking the action you want them to take.
Conversion rate, then, measures how many customers took an action you wanted them to.
A higher conversion rate shows that your website is made well enough to effectively persuade visitors to become customers.
If not, it is high time to optimize your website.
Social Media Engagement
Nowadays, apart from having a website, it has become a norm to have a social media profile.
Everyone is using social media, and frequently, Instagram and Facebook are the first places your potential customers check when searching for restaurants.
Measuring social media engagement, another marketing KPI, includes metrics like likes, comments, shares, and follows on your social media posts.
In other words, this KPI reflects your audience's level of interaction and interest in your content.
For example, high engagement suggests that your social media content resonates with your audience, which can increase your visibility and get you more followers.
Also, you can achieve a stronger connection with potential customers through social media.
Customer Acquisition Cost (CAC)
The last key performance indicator we will mention today is customer acquisition cost—the cost of acquiring a new customer through your marketing strategy.
It includes expenses such as advertising, marketing campaigns, and any associated overhead.
You can calculate it with this formula:
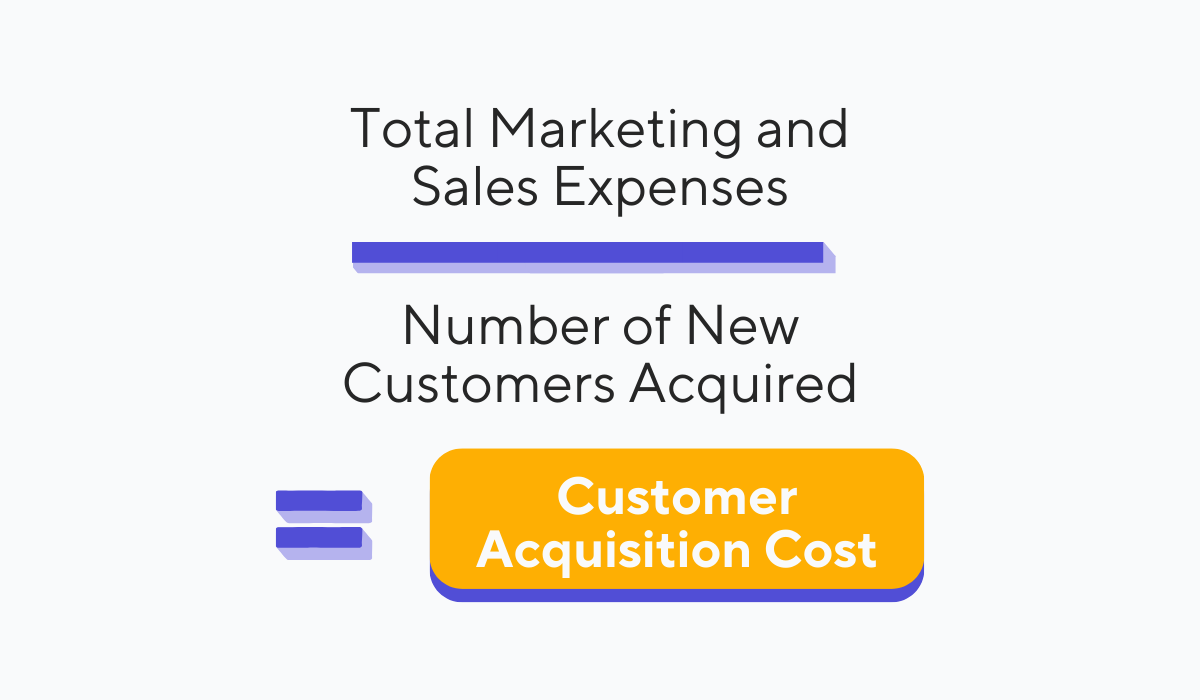
Source: Tablein
Understanding this KPI helps you evaluate the cost-effectiveness of your marketing campaigns.
A lower CAC indicates efficient customer acquisition, while a higher CAC may require adjustments in your marketing strategy.
All in all, marketing KPIs provide valuable insights into your marketing efforts.
This allows you to assess the effectiveness of your website, social media presence, and marketing campaigns.
Ultimately, all this can help you optimize your marketing strategies and enhance your restaurant's success.
Conclusion
And with that, we have come to an end.
In this extensive article, we have covered the five types of restaurant KPIs that every restaurant owner should know about—and keep track of.
From profitability KPIs that unlock ways to increase earnings, reservation KPIs that address the issue of last-minute cancellations and no-shows, and finally, to customer experience and marketing KPIs that empower you to improve your restaurant's digital presence and customer appeal.
All the key performance indicators that we mentioned today are invaluable tools to drive business improvement, attract more patrons, and ultimately enhance profitability.
We strongly recommend you measure and analyze these KPIs!
Share this

Navigating Restaurant Operations: 6 Challenges Every Owner Faces

8 Tips to Help You Make the Most of Your Restaurant Capacity